Installation Procedure
Procedure
Download the navigationLink zip file from https://files.trendminer.com/hps/pivision/.
Use the file explorer to go to the PI Vision directory. In the file explorer navigation bar type in %pihome64%, this will open up the PI Vision directory, e.g. C:\Program Files\PIPC
Navigate to \PIVision\Scripts\app\editor\symbols\ext
E.g. C:\Program Files\PIPC\PIVision\Scripts\app\editor\symbols\ext
Extract the downloaded file in this directory.
Important
Do not change the names of these files.
Three files are added to this directory:
sym-navigationLink.js
sym-navigationLink-config.html
sym-navigationLink-template.html
Three directories, each containing one file, are added to this directory:
libraries/angular-piwebapi-kerberos-1.11.0.min.js
icons/trendminer-icon.svg
assets/open-in-trendhub.svg
Confirming the plugin is visible within PI Vision.
Go to PI Vision
e.g. https://example.com/PIVision, example.com has to be replaced with the configured url.
Click on 'New Display' in the top right of the screen.
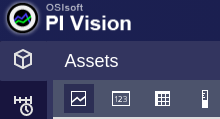
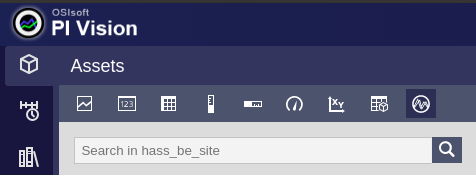
A new 'symbol' (highlighted in the picture below) has been added.

Example usage
For this example another 'symbol' will be used to provide the data we want to visualize in TrendHub. More specifically the 'Trend symbol' will be used.
Click on 'New Display' in the top right of the screen.

Select the 'Trend symbol' in the top bar.
Select in the list below the assets or attributes/tags you want to visualize.
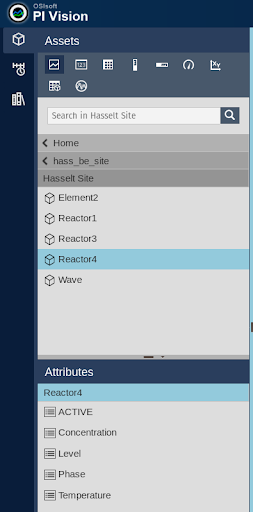
Drag and drop the selected asset or attribute/tag onto the dashboard.
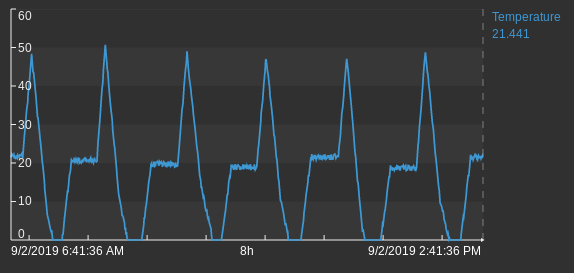
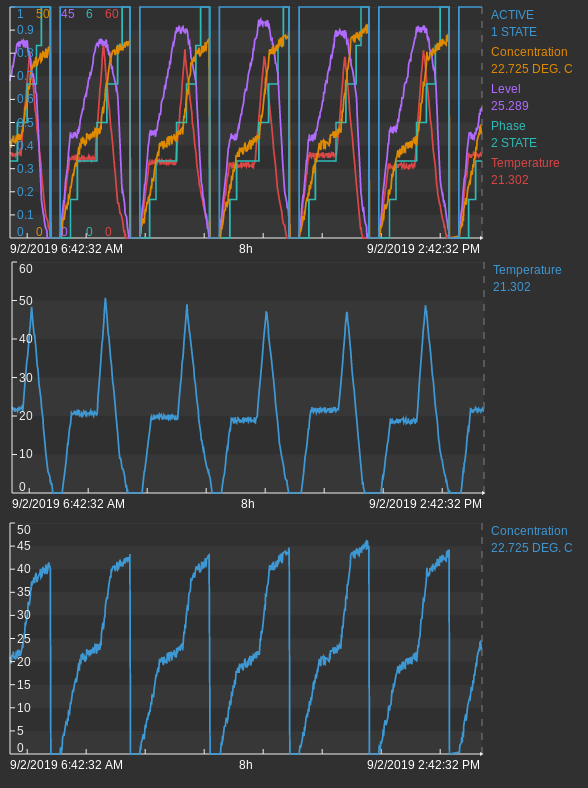
Example asset:
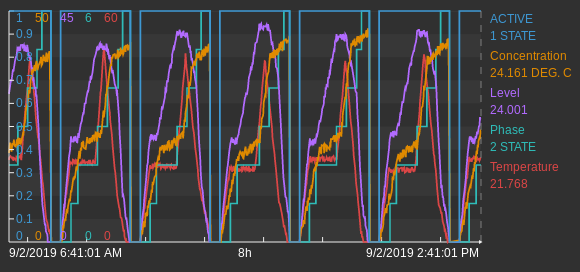
Example attribute/tag:
Repeat step 1-3 if you want to add multiple assets or attributes/tags.
Select the 'TrendMiner Navigation Link symbol'.
Select an asset or attribute/tag.
Note
This can be any random attribute/tag, it will not be included in the attributes/tags that will be visualized in TrendHub. Selecting an attribute/tag in order to be able to drag and drop a symbol on the dashboard is a requirement of PI Vision.
Drag and drop the 'TrendMiner Navigation Link symbol' onto the dashboard.
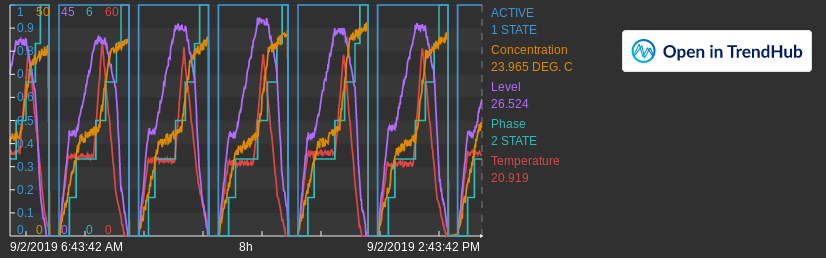
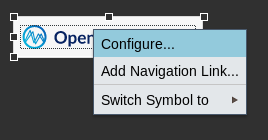
Right click on the 'Open in TrendHub' button and select 'Configure...', resulting in a sidebar appearing on the right side of the screen.
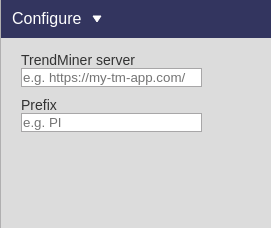
TrendMiner server: the full url pointing towards the TrendMiner installation e.g. https://my-trendminer-application.my-company.com.
PI Web API url: the full url pointing towards the PI Web API e.g. https://my-pi-web-api-server.com/piwebapi
Prefix: Sometimes historian servers in TrendMiner are configured with a prefix. Ask an admin what the configured prefixes for the servers are. If no prefix has been configured, this field can be left empty.
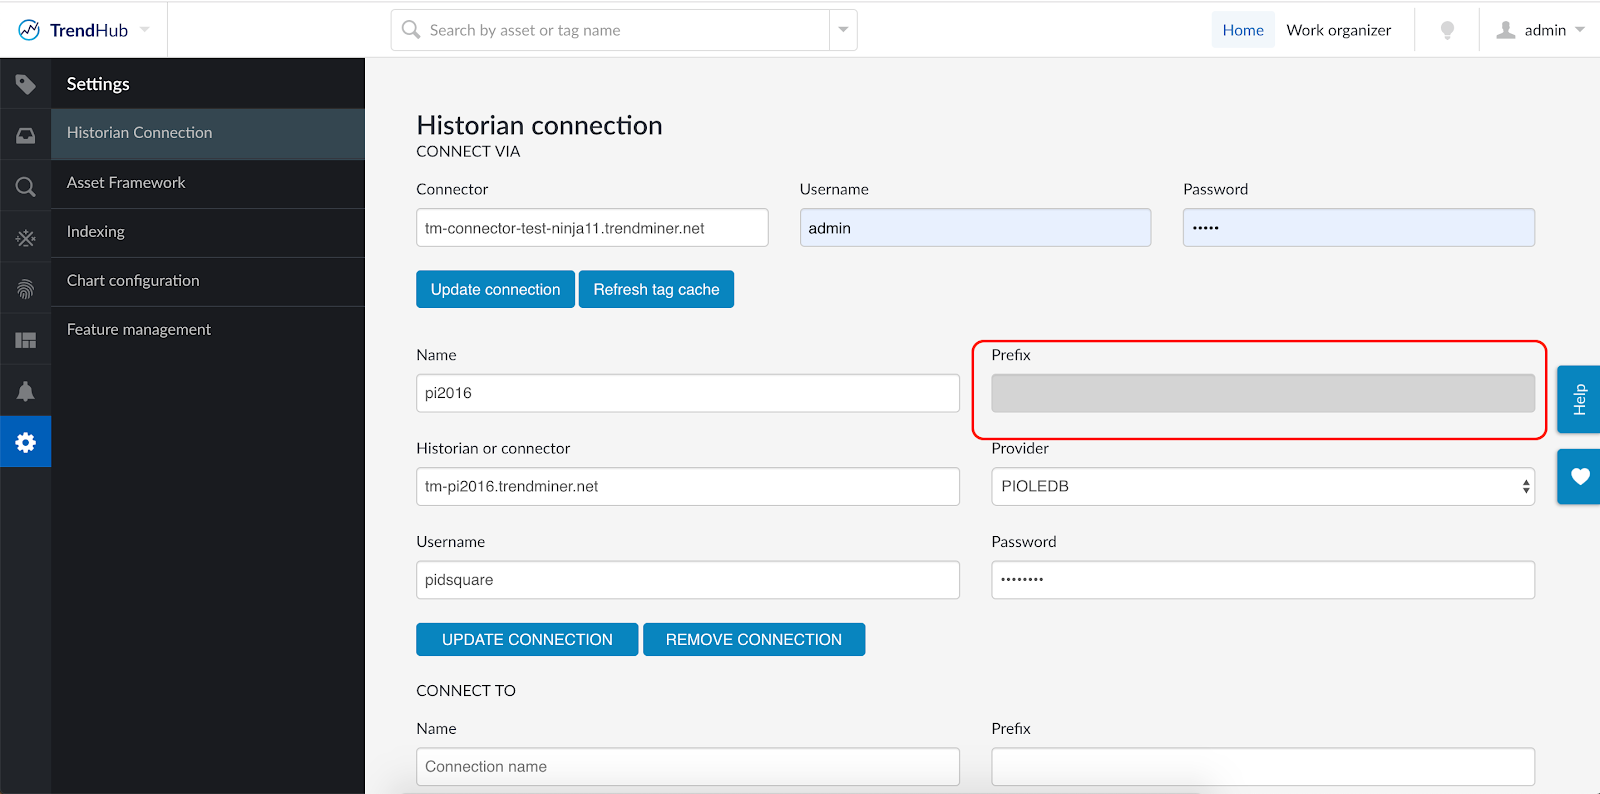
The screen where a configured prefix can be found by an admin.
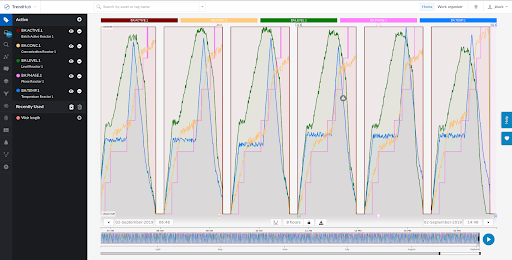
Click the 'Open in TrendHub symbol' on the dashboard. This will open a view in TrendHub, visualizing all the attribute/tags that are configured on the other symbols that are on the dashboard.
Note
Duplicate attributes/tags will be filtered out. In the examples used in this guide 'Temperature' and 'Concentration' are visible twice on the dashboard (step 5), once in the TrendHub visualization.
Important
All attributes/tags (used in steps 3. and 4.) must come from the same 'historian server'. Or in other words, they all need to use the same prefix (as described in step 9b).