Synopsis
Multi-scatter plot for context views
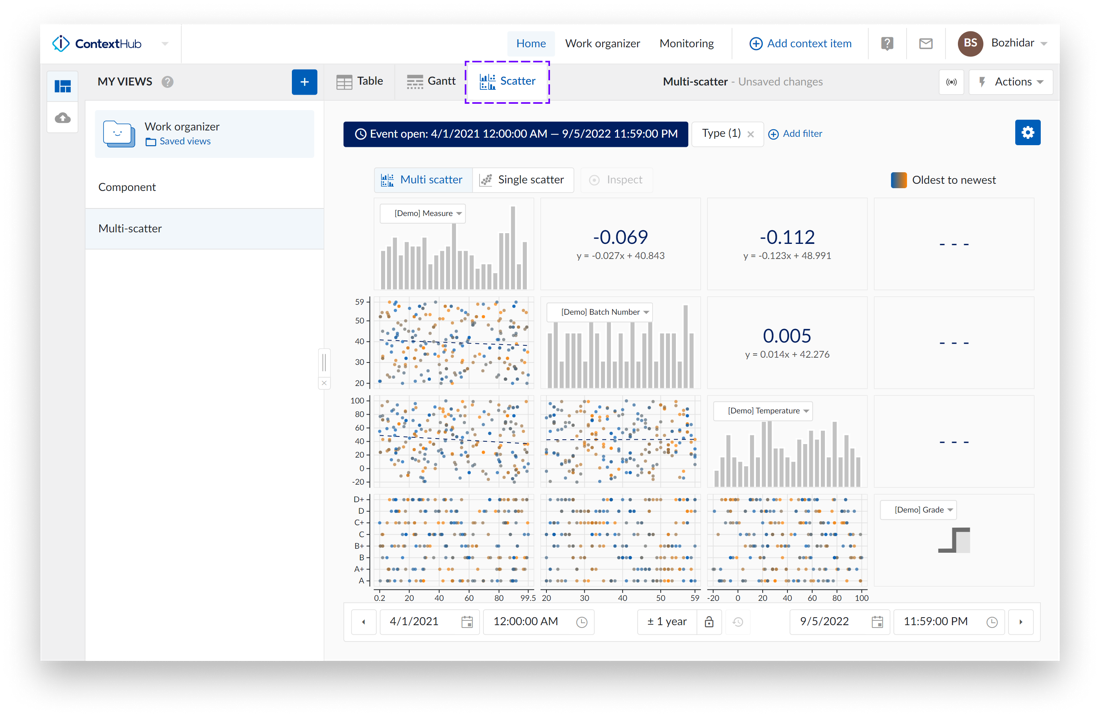
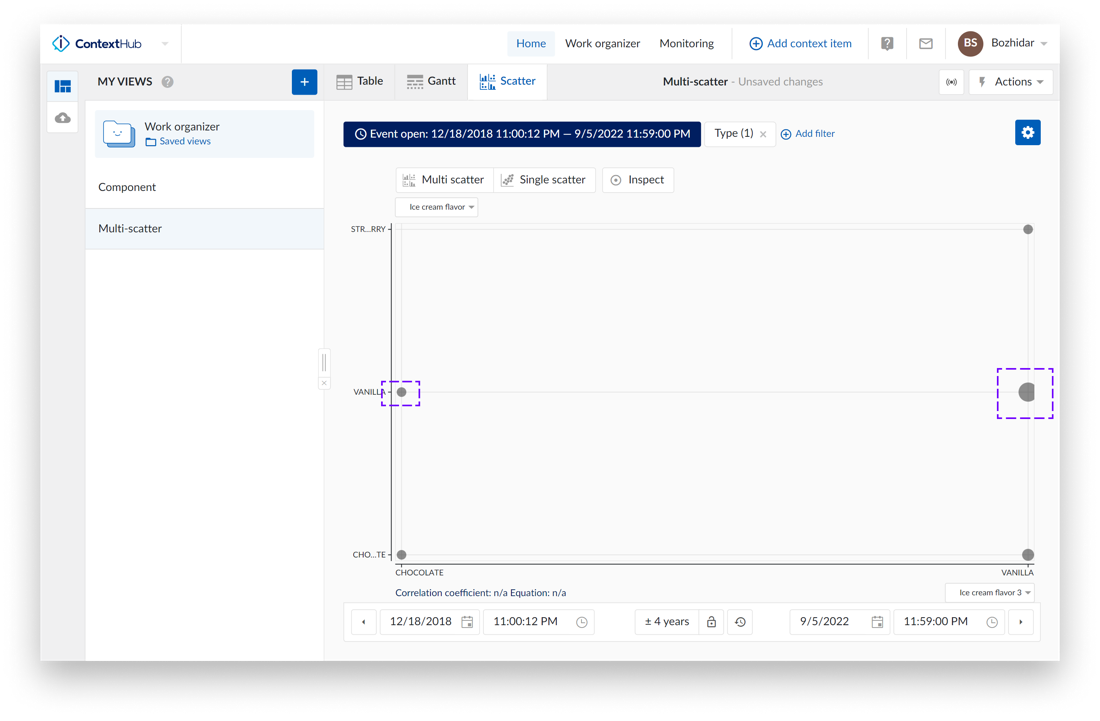
With the Multi-scatter plot you can plot context data fields on a scatter chart to gain insights of correlations and distributions regarding events.
The “Scatter” tab in ContextHub can be found top of the display next to “Table” and “Gantt” visualization options.
Scatter configuration can be accessed by clicking the “Settings” button -  , located top right.
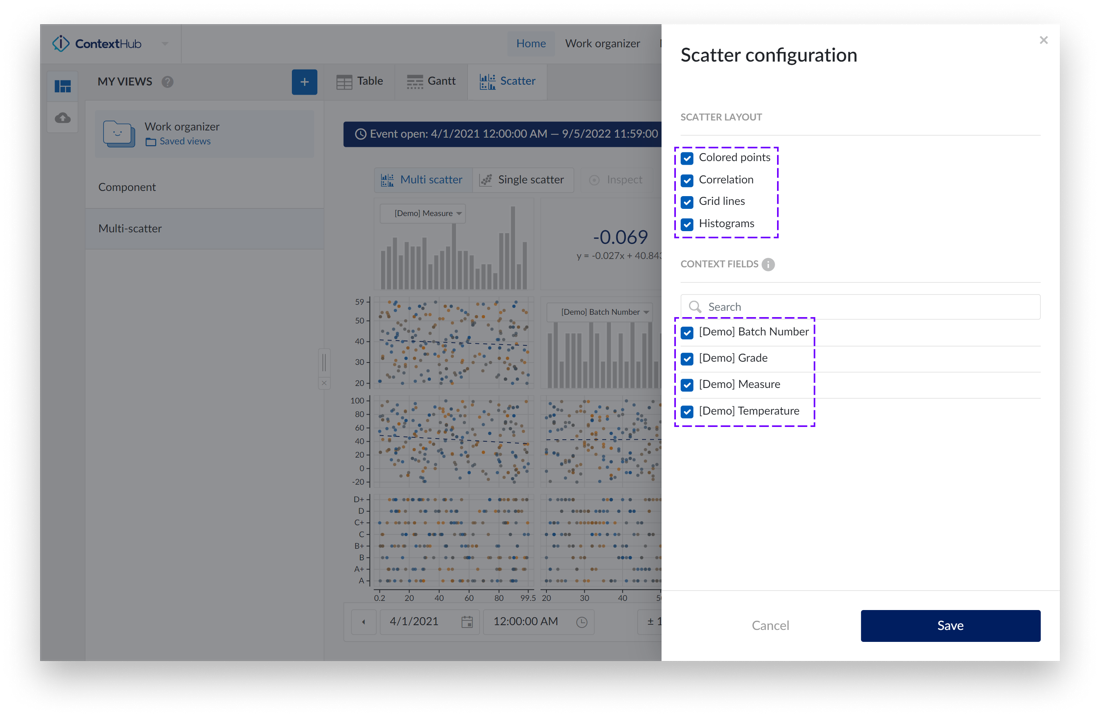
There are 4 chart options available:
Colored points – data points are displayed in a color scale from blue to orange, representing the transition from oldest to newest data points.
Correlation – additional tiles are displayed that represent the correlation coefficient together with its equation value for a specific scatter plot.
Grid lines – grid lines appear, making it easier to read values on the charts.
Histograms – show/hide histograms.
Listed below the layout configuration options, are all available fields that can be plotted on the chart.
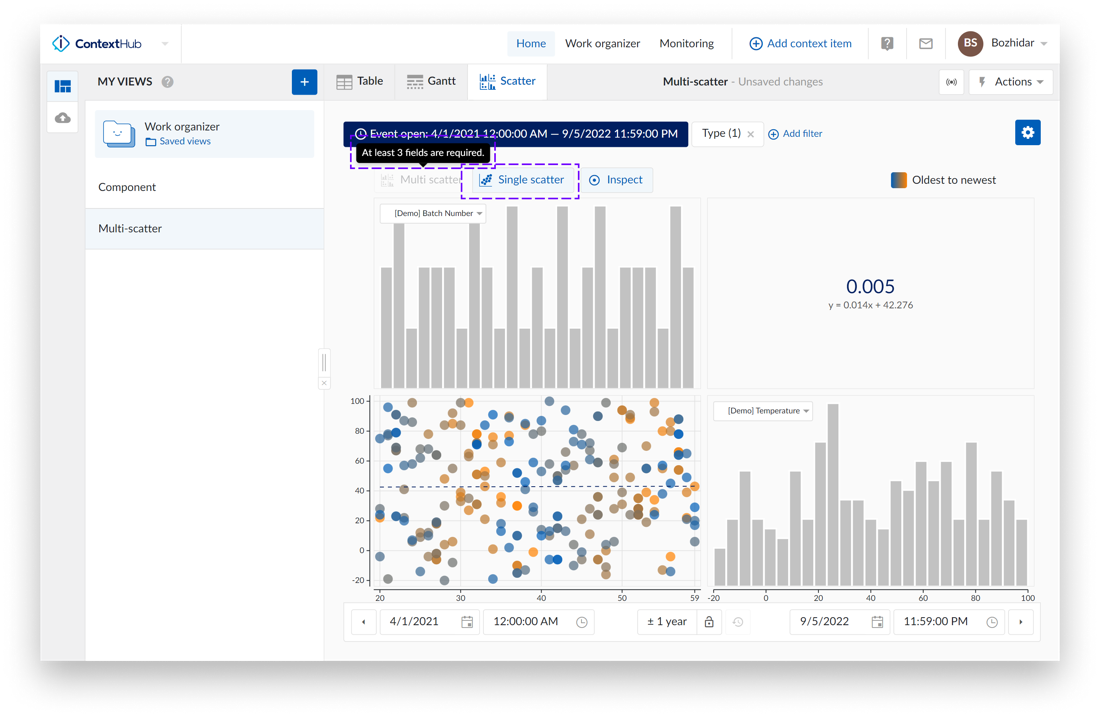
Navigation between multi scatter and single scatter mode is done by using the navigation on the top.
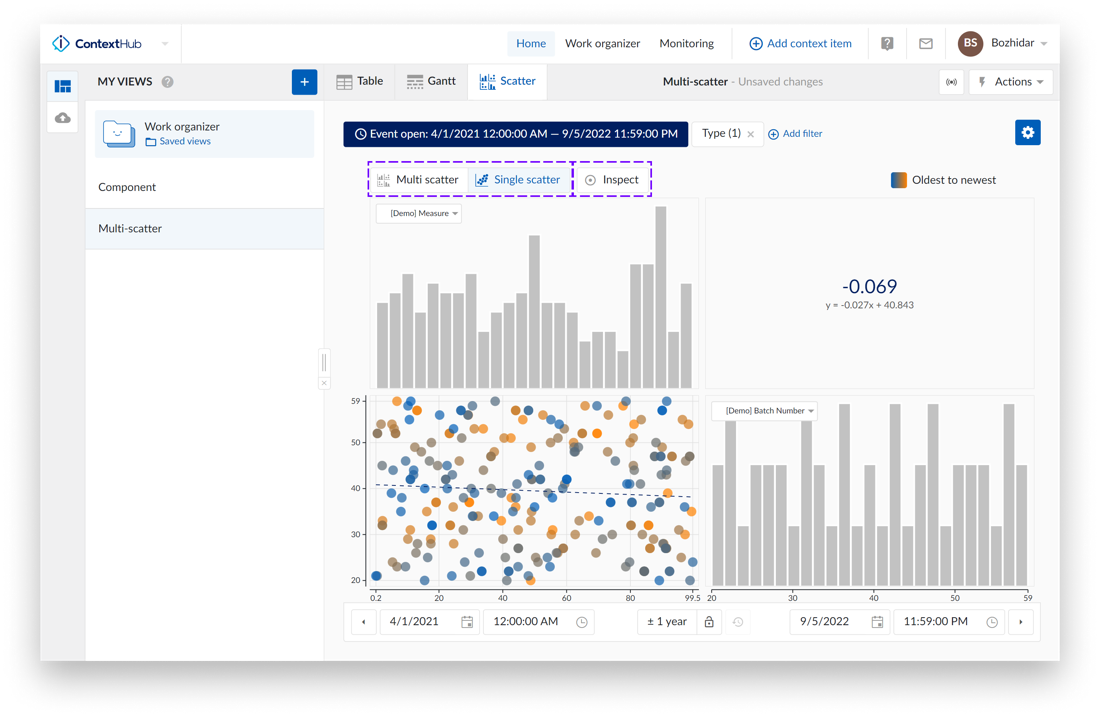
The level that you are currently in is highlighted in blue. If you hover over a disabled navigation button a tooltip appears with additional information about why the button is disabled.
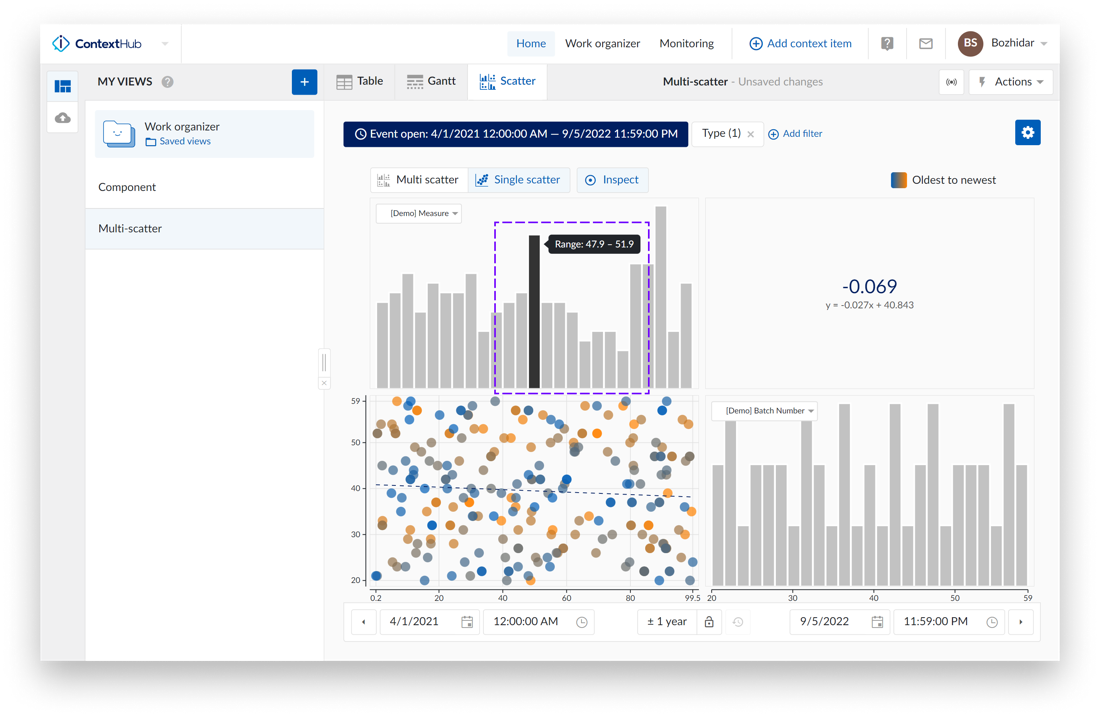
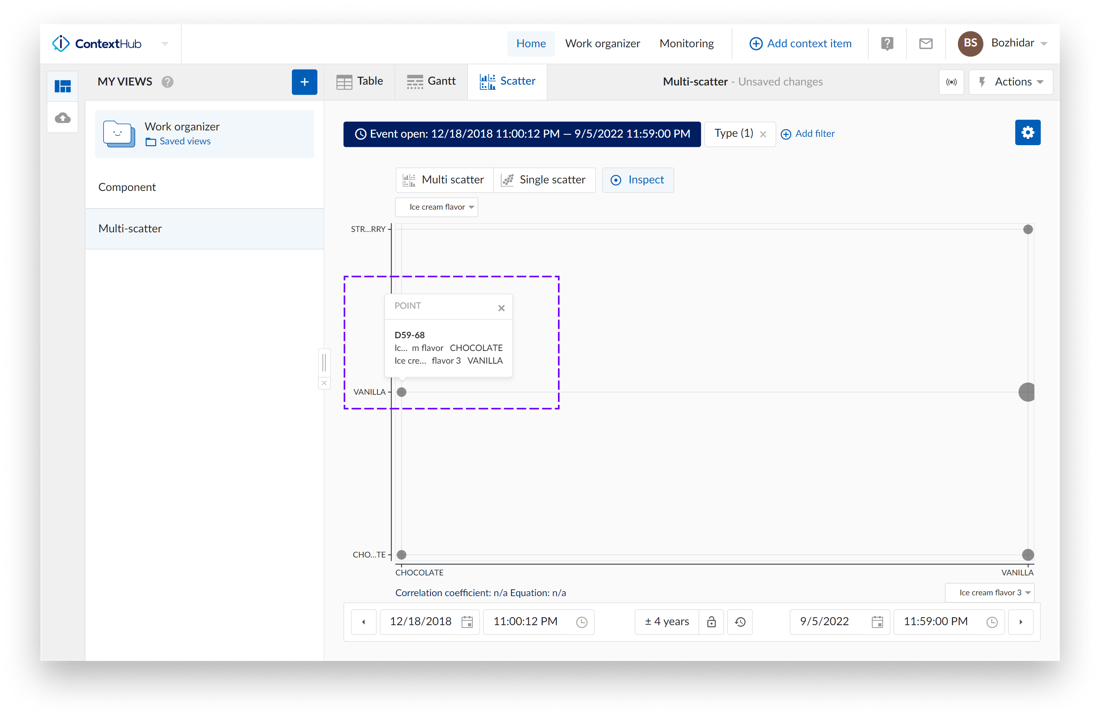
When “Inspect” is enabled you can hover over a histogram to show the range, or hover over a point (or cluster of points) to show details about them. If you click on a point/cluster of points the tooltip will become sticky. To close the tooltip– click on the “x” button located on the top right on the tooltip.
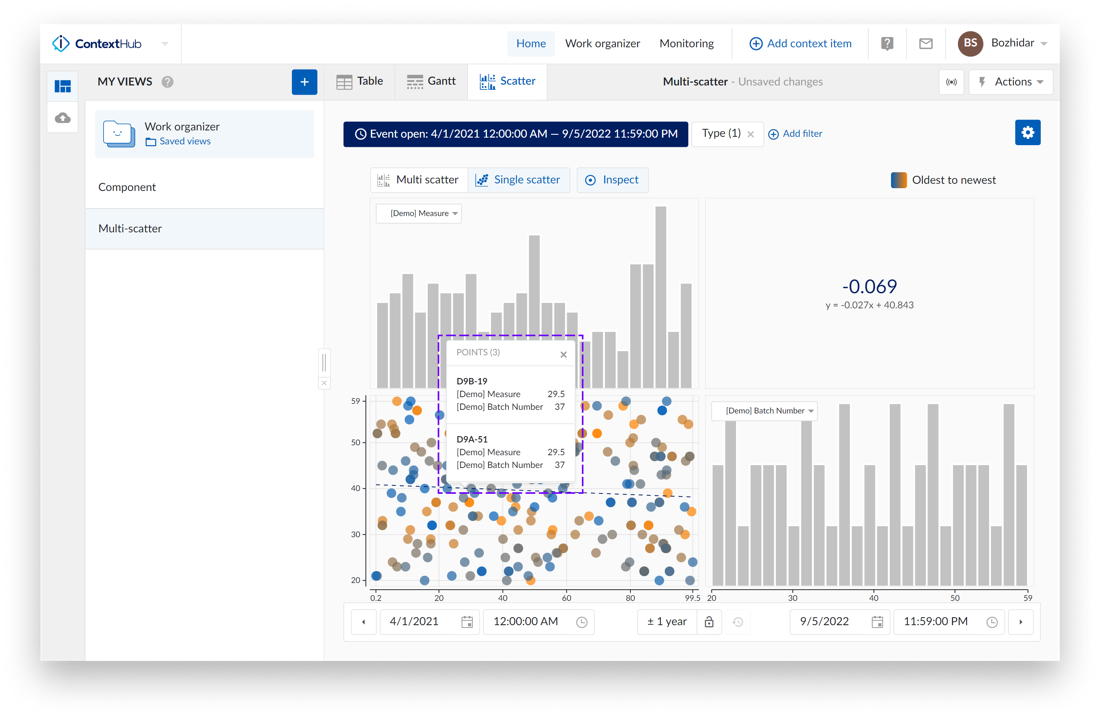
For two dropdown fields the scatter chart will appear as a bubble chart – the bigger the point on the chart, the more data points it contains.
If we inspect the two points on the chart – the one on the left side has one point:
The one on the right has five points:
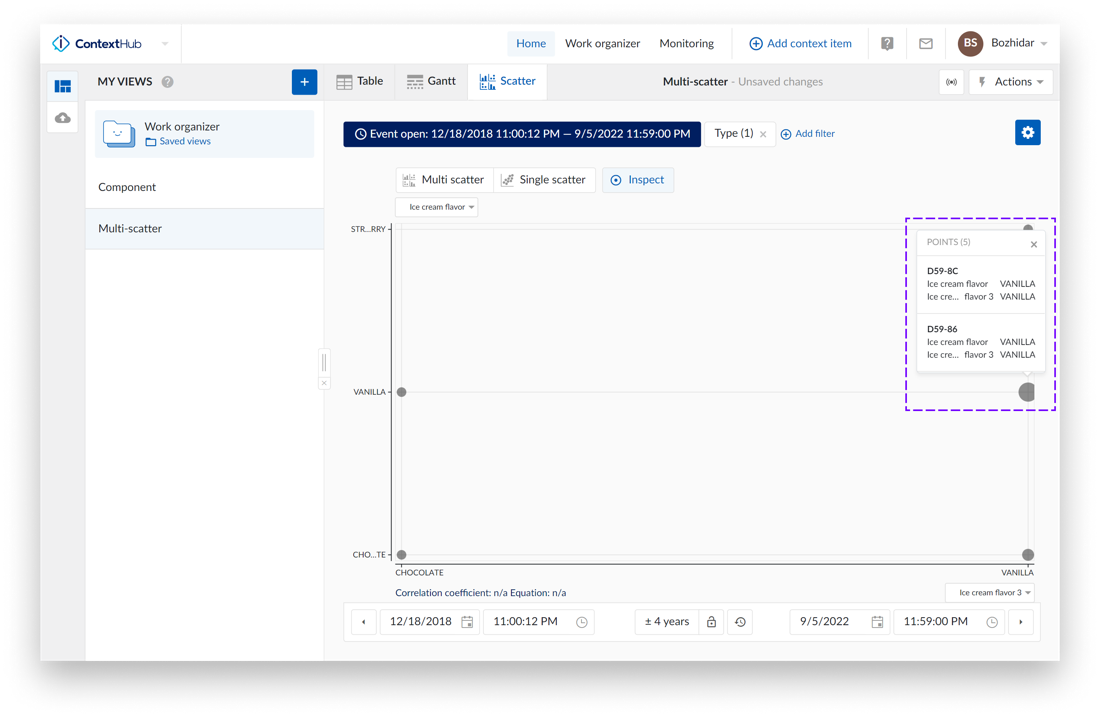
Note
“Colored points” are not supported for the bubble chart.
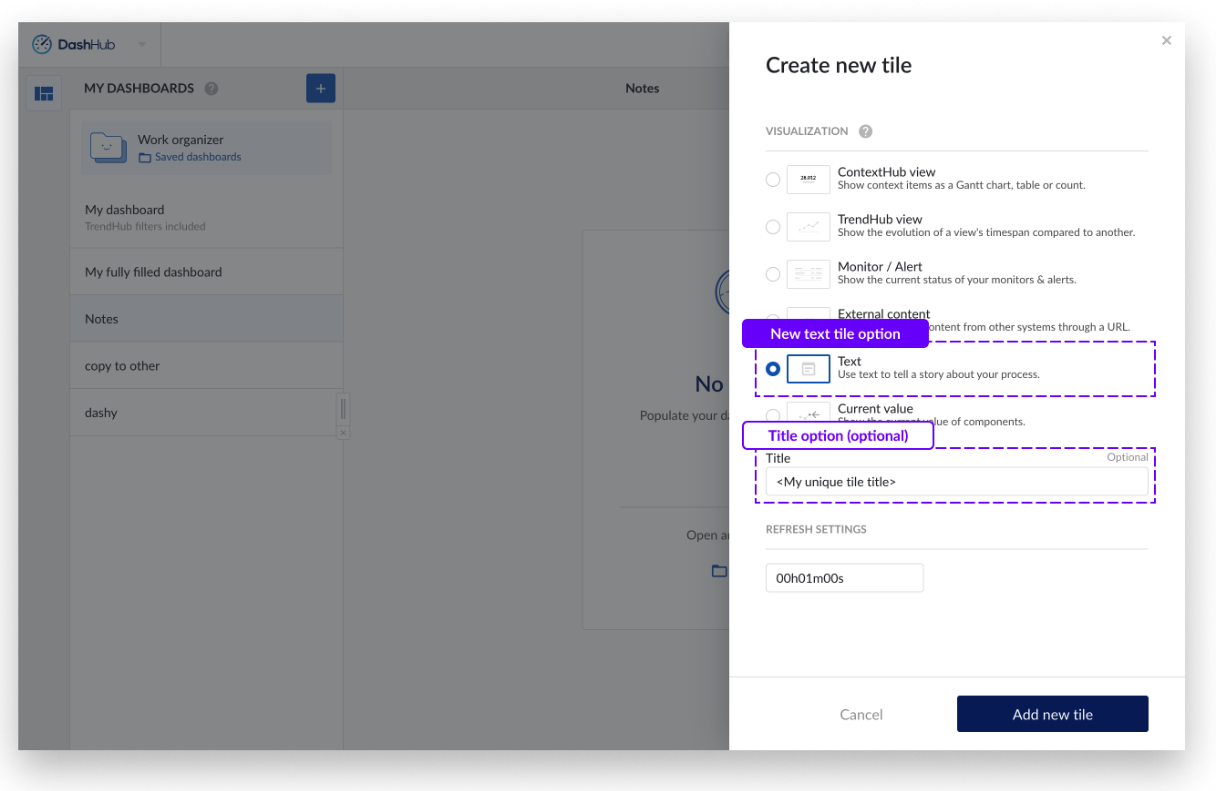
Dashboard - Text tile
The text tile provides the opportunity to add more information, add data to a dashboard and unlocks the capability to drive storytelling and journaling with your dashboards.
The new text tile can be found in the tile list when creating a new tile.
All options are present in the tile itself for easier access and a quicker way of working.
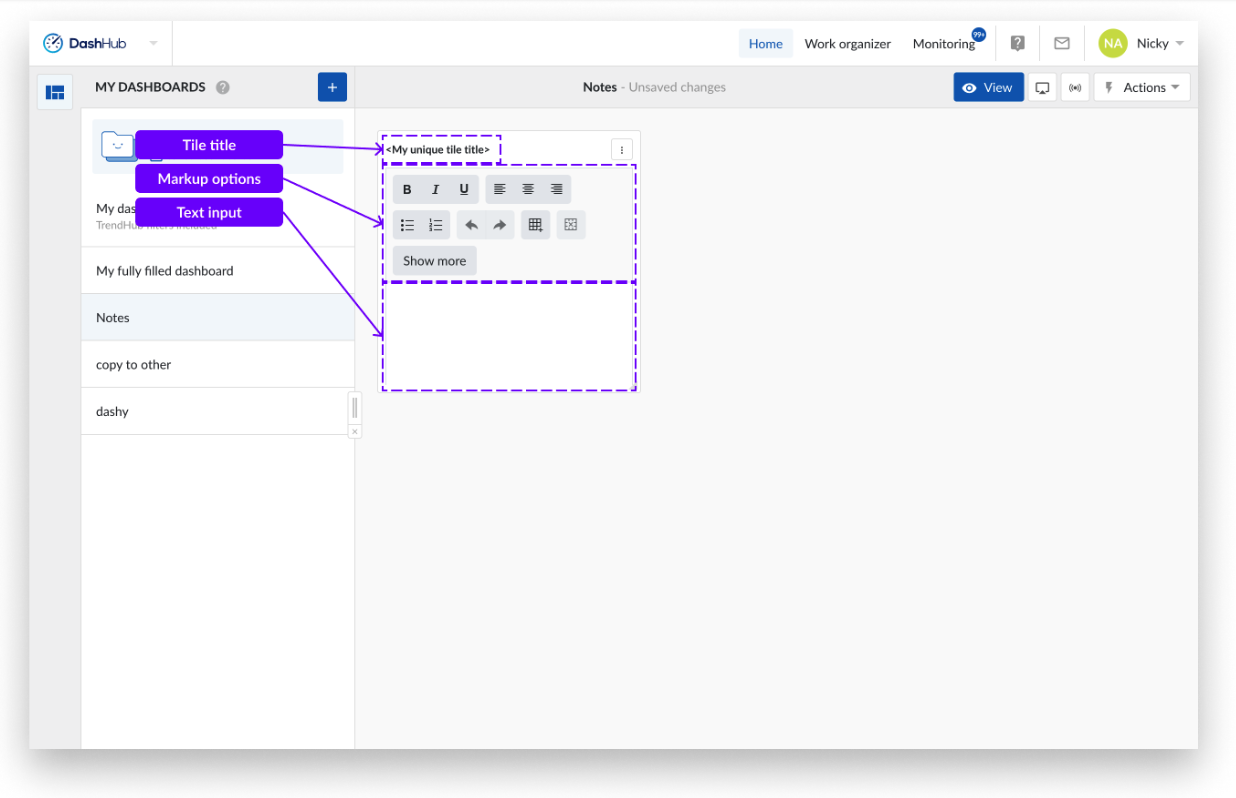
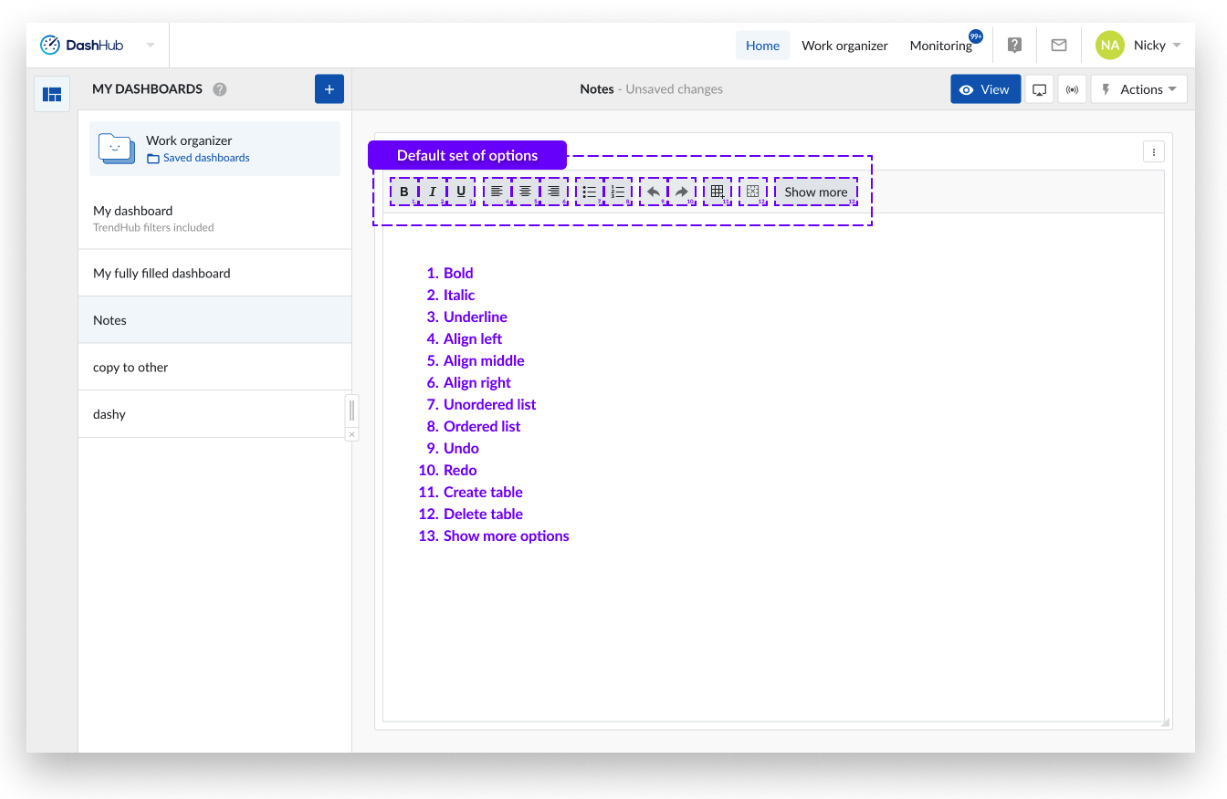
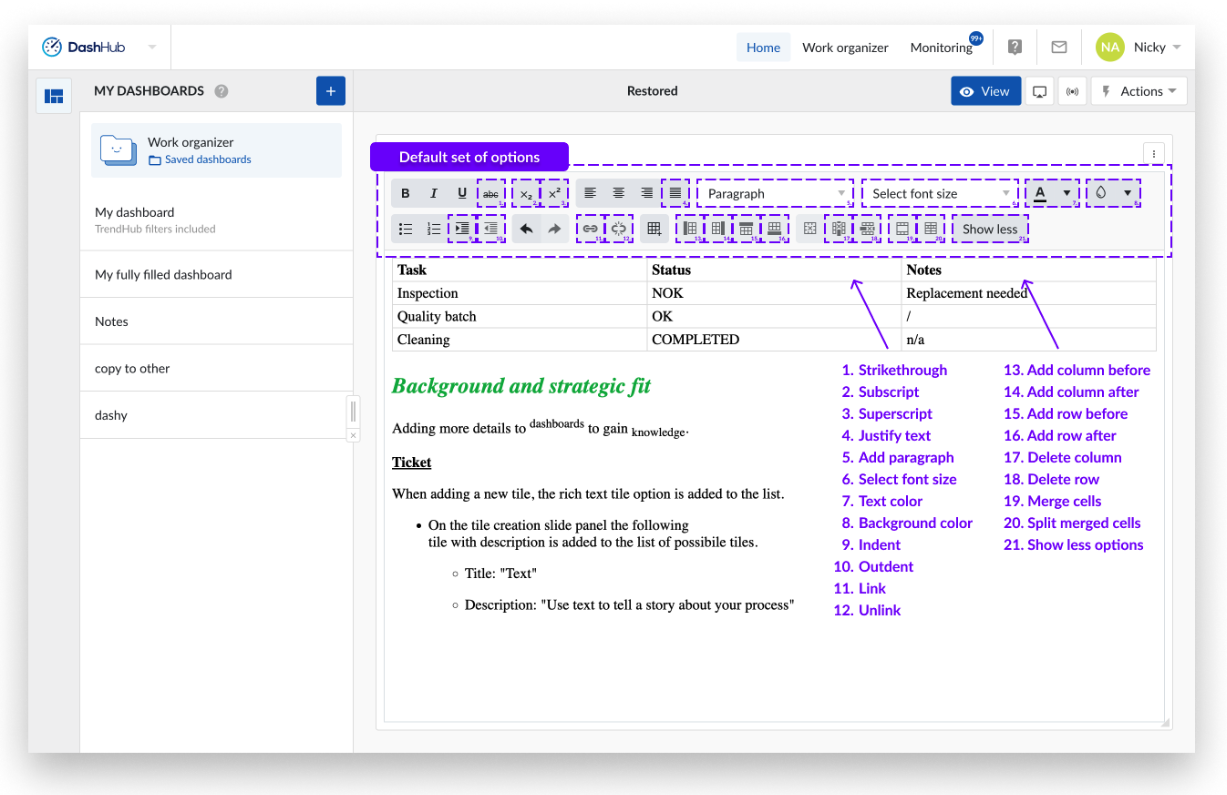
By default, a basic set of options is displayed. Clicking on the "Show more" button reveals even more options. Which can also be hidden using the "Show less" button.
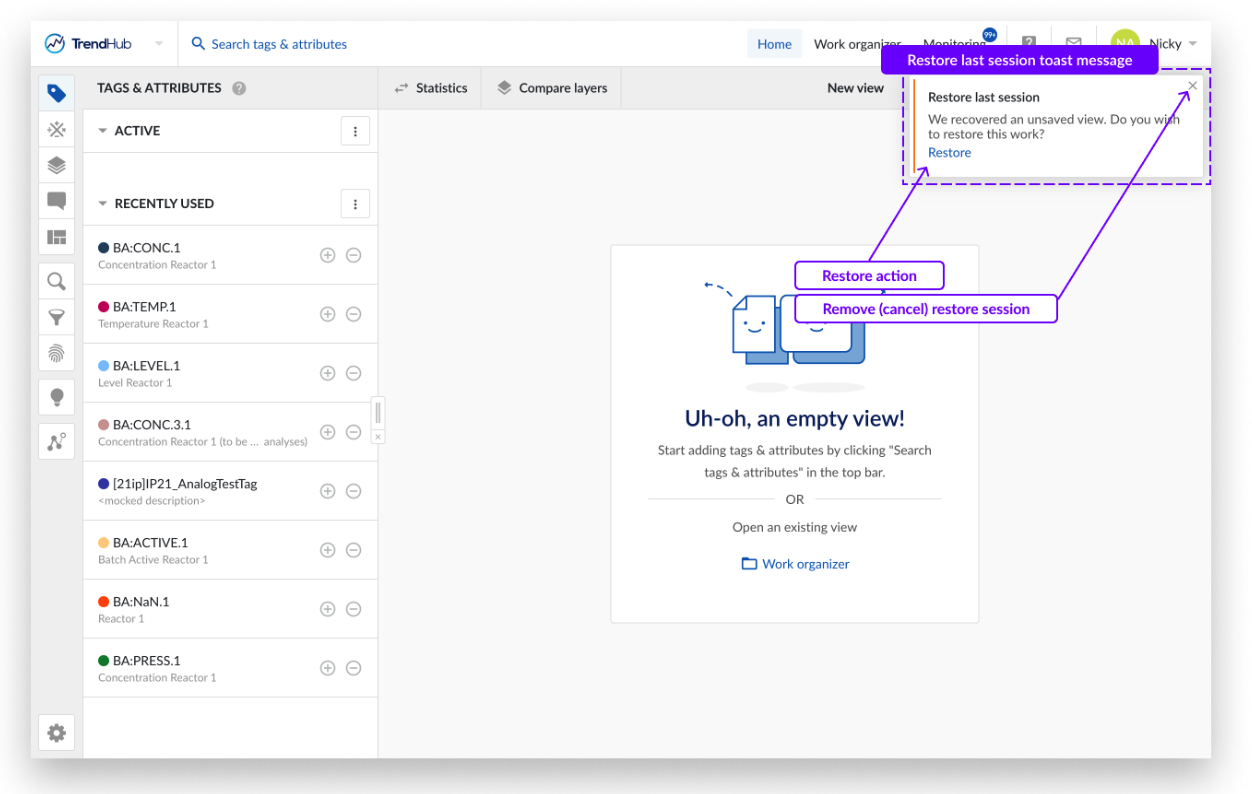
Restore Last Session
In the previous TrendHub we could work with the URL links to retrieve "lost" sessions due to a crashed browser, lost connections or being kicked out of a session.
With this feature, an autosave action is operated, meaning that when something unexpected happens and the browser freezes, an option appears in the next session in the form of a toast message, where the " lost view " can be restored.
This option also works in ContextHub and DashHub.
Extended AspenTech InfoPlus 21 connectivity
Exiting connectivity of TrendMiner with InfoPlus 21 was based on an approach involving Aspen SqlPlus queries, as of now, connectivity with AspenTech InfoPlus 21 historian can be established with a stored procedure.
To enable the stored procedure-based approach, use the webconfig property “ip21.history.storedprocedure“. The flag is set to “false” per default and must be set to “true” to enable connectivity via a stored procedure. The SQL code within the stored procedure must be prepared by the historian administrator, who knows the data structure and what data must be obtained.
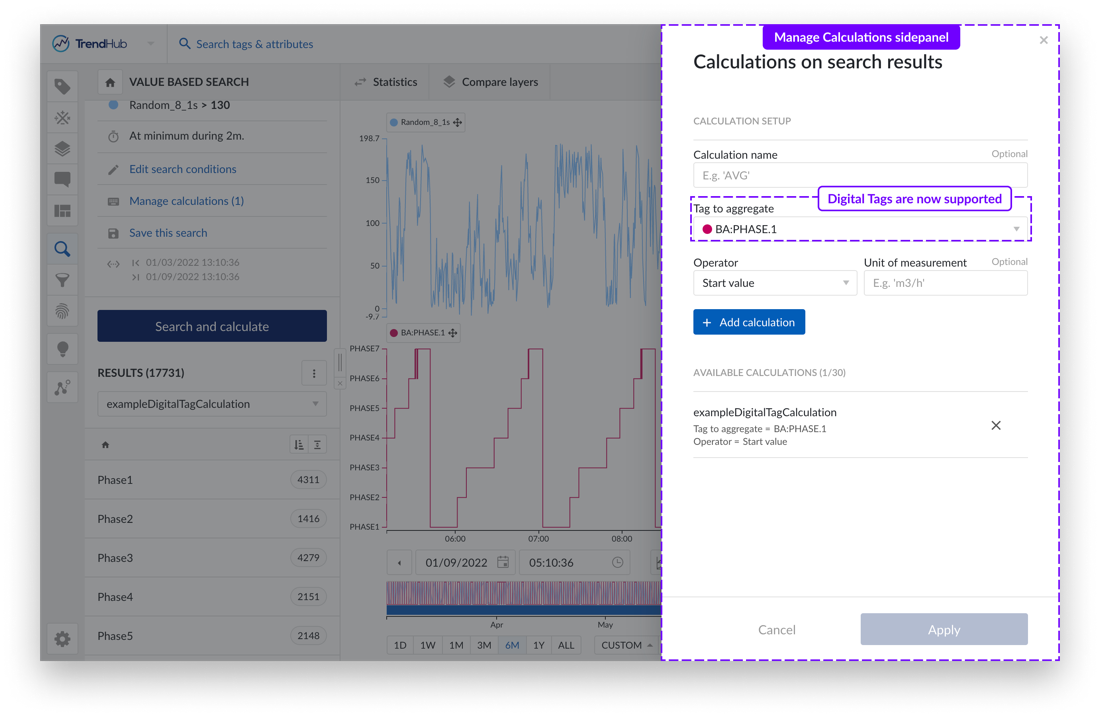
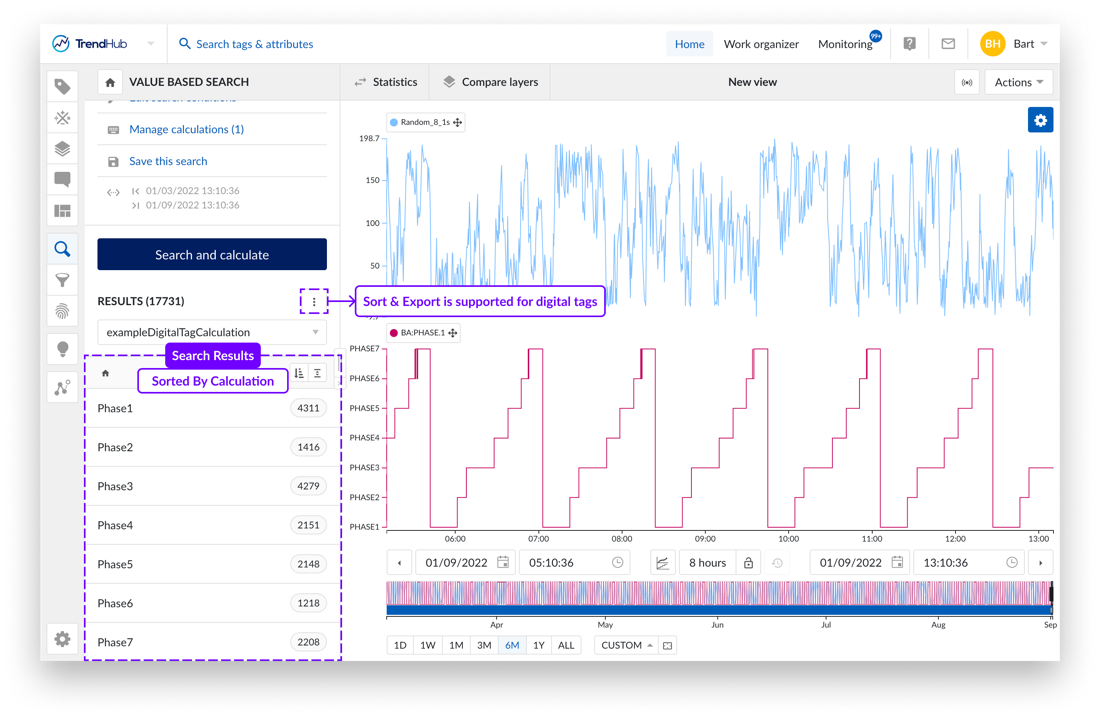
Search Calculations – Support for Digital Tags
In previous releases only analog tags could be selected as calculation on top of search results. This release enables you to add digital tags as a calculation too. The supported operators for digital tags are the "start"- and "end"-value which gives more insight in which state the search conditions are starting or ending. E.g. Is a valve in the open or closed state, return the batchID or recipestep for a particular search result.
This added calculation can then also be leveraged in further actions like sorting per state, and including the state when exporting as with any other calculation.