Diagnostics
The Edge Manager diagnostics page contains the following functionality:
Extract appliance logs
"Collect and export (recent)": when clicked, TrendMiner will generate an archive file containing the 'light logs' and start the download once the archive file is available. The 'light logs'/'recent logs' will contain only recent data and will also contain less data. Gather these logs for issues which occurred the last day(s) and are unrelated to performance or service crashes.
"Collect and export (full)": when clicked, TrendMiner will generate an archive file containing the 'full logs' and start the download once the archive file is available. The full logs will contain more historical logging (up to a week or longer) and will contain more data. The full logs are required for more profound troubleshooting, performance analyses, ...
When in doubt about which log files to collect, please collect the full logs.
Memory
Insight in available memory and memory usage of TrendMiner.
Tip
The memory usage you see in ConfigHub is expected to be high since Linux occupies all available memory. More info can be found here: https://www.linuxatemyram.com
Memory usage will stay high even if you would add more RAM.
Disk usage
This table shows the available disk space and the total disk space of the /mnt/data volume (the volume on which the TrendMiner appliance is installed and TrendMiner stores its data).
Next to the /mnt/data volume there is also the root volume, on which the OS and system services are running. Both the root volume and the /mnt/data volume can run out of disk space which in both cases will result in service interruption.
The root volume total disk space and usage is not shown in Edge Manager since TrendMiner does not actively use this volume. Disk space issues should not occur on this volume if the system requirements are met. For more info on the required disk space of both the root volume and the /mnt/data volume, please contact our server requirements page.
The /mnt/data volume is used by the TrendMiner application for storing data. This data mainly consists of:
Info stored in the database, e.g. saved work from users.
Index data
Logically, the more usage and the more tags are being used, the more disk space will be required. The minimal disk space requirements listed in our installation guide are in general sufficient to start with TrendMiner but when usage increases it will be required to add more disk space.
How much disk space is needed is very dependent on the exact usage, type of tags, specific configuration but since the tag index data is taking up most of the disk space the following upper limit[2] can be used to calculate the required disk space:
Index resolution | Disk space required | Examples |
|---|---|---|
60 seconds | Worst case: 17MB/tag/year | 1k indexed tags with 3 years of index data = 51GB |
Average case: 1-10MB/tag/year | 1k indexed tags with 3 years of index data = 3-30GB 10k indexed tags with 5 years of index data = 50-500GB 100k indexed tags with 2 years of index data = 200-2000GB | |
5 seconds | Worst case: 204MB/tag/year | 1k indexed tags with 3 years of index data = 612GB |
Average case: 12MB/tag/year | 1k indexed tags with 3 years of index data = 36GB 10k indexed tags with 5 years of index data = 600GB 100k indexed tags with 2 years of index data = 2.4TB |
Important
It is always possible to add more disk space but once disk space is added it is not possible to remove it again!
CPU
Insight in available vCPU and actual CPU usage of TrendMiner.
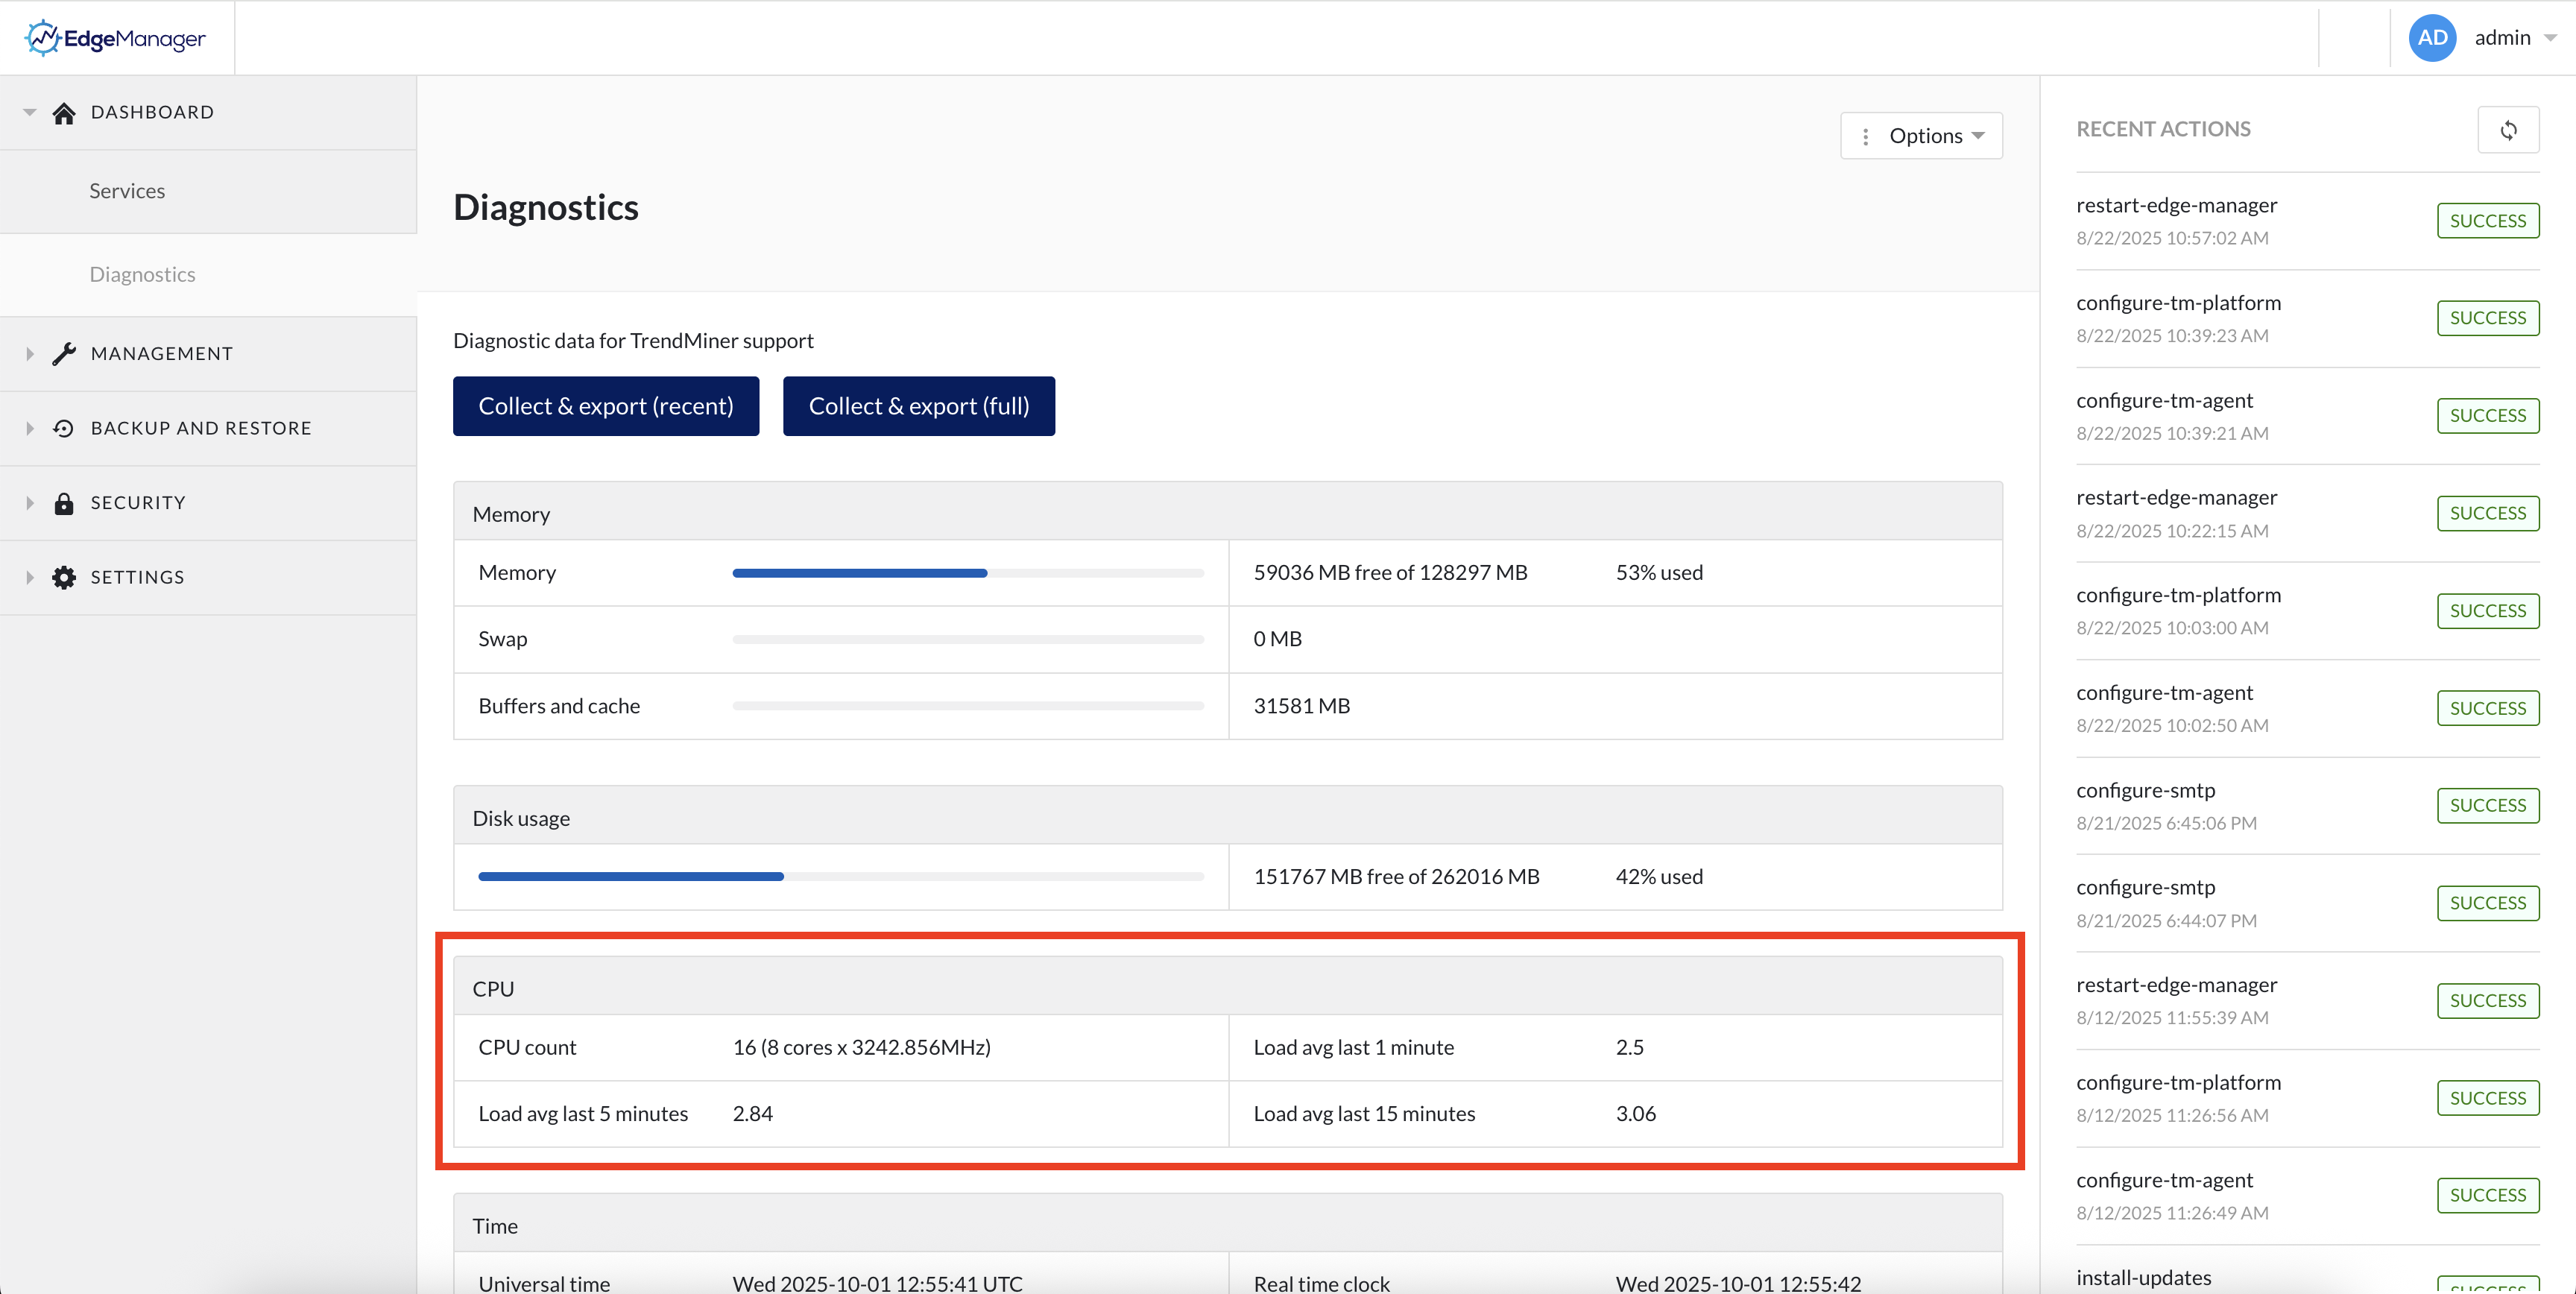
The CPU load values represent the average number of runnable or waiting processes (CPU + I/O). Think of it as “how many people are standing in line for the CPU”. A value of 1.00 on a single-core system means the CPU is fully utilized. On a quad-core system, 4.00 would mean full utilization.
If you have 16 CPU cores the "safe" load threshold is around 16.00.
Load < number of cores → system is healthy.
Load ≈ number of cores → system is busy but OK.
Load > number of cores → system is overloaded (processes are waiting).
Time
Time settings of the TrendMiner server. Please make sure that the NTP server is well configured and synced to avoid logout issues.
Export metrics
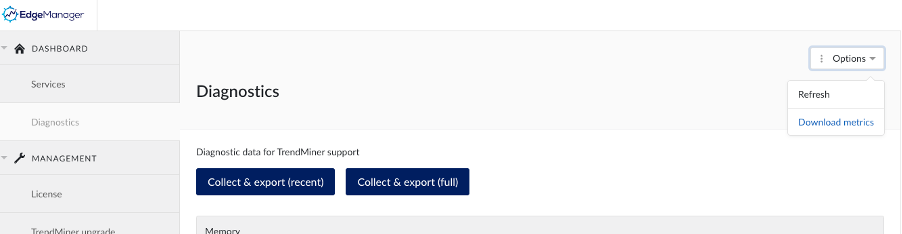
Via the “Options” button at the top right, you can click “Download metrics”, to trigger the export of the metrics data.
More information about metrics collection can be found here: License audit
[2] The worst case scenario is based on tags with very frequent changes/fluctuations and assumes all tags have data up till the index horizon. In practice this is never the case.