Why do values of calculated tags change when navigating on short time periods?
You may notice that when you zoom in or change the time period you're viewing, calculated tags (especially those involving variables with small time shifts) can show slightly different results. Why does this happen?
Short answer
Based on the period you are visualizing, TrendMiner uses a different source to pull the data from. On a system with an index resolution of 1 minute, TrendMiner will plot from index data for periods larger than 5 hours. When visualizing periods below 5 hours, data will be directly fetched from the data source. Also for calculated tags, data will be fetched from the data source and calculations will be done "on-the-fly".
TrendMiner requests plot-optimized data from your data source in different time windows depending on what you're viewing. The data source selects raw data points at timestamps that best represent each period for plotting. TrendMiner then interpolates between these points as needed. When calculations involve time shifts (such as comparing a tag to itself 3 seconds earlier), each new window (caused by a small navigation change) can return different raw data points from the historian, causing variations in the results.
Detailed answer
When you view time-series data, TrendMiner requests a fixed number of data points (typically 300) from your data source, spread evenly across your viewing window. The data source doesn't return every single raw data point stored - instead, it uses algorithms like PI's "best fit" to select which actual raw data points will best represent that time window for plotting.
This means that the raw data points that get returned by the historian when visualizing a period of 10 minutes or 1 hour can be different.
TrendMiner then interpolates between these historian-selected raw data points when exact timestamps are needed for calculations.
The key issue: different viewing windows cause the historian to select different raw data points, which then leads to different interpolated values, hence different calculated values.
Why shifted calculations are affected
When you create a calculation that involves a time shift (like abs(TagA - TagA shifted by 3 seconds)), here's what happens:
For the original tag: TrendMiner requests plot-optimized data for your viewing window (e.g., 10:00 - 11:00), and the historian selects raw data points for that window
For the shifted tag: TrendMiner requests plot-optimized data for the shifted window (e.g., 9:59:57 - 10:59:57), and the historian selects raw data points for that different window
Because these are different time windows, the historian selects different raw data points for each request. TrendMiner then interpolates between these different sets of points, which can produce notably different calculated values.
Why results change when you zoom
When you change your viewing period (while staying under 5 hours), TrendMiner requests plot-optimized data for the new window. The data source selects completely different raw data points that best represent this new window. Combined with TrendMiner's interpolation on these different points, this explains why:
Zoomed out (1 hour): Historian selects 300 raw data points from the hour
Zoomed in (10 minutes): Historian selects 300 different raw data points from those 10 minutes
Each zoom level gets a different set of raw data points selected by the historian, leading to different interpolated results.
Visual example
Consider the earlier calculation example: abs(TagA - TagA shifted by 3 seconds) . You might have created this tag to capture a sharp decrease within a second. By shifting this tag by 3 seconds, you expect a new time series tag - usually with a value around 0, that spikes to the difference value for a few seconds.
The following image shows how the difference is calculated when the visualized window is under 5 hours and the data source returns 300 plot-optimized points, which omit some raw data points. The figure shows the raw data points of Tag A, as stored in the data source as well as the plot-optimized data that gets returned for Tag A and its shifted counterpart.
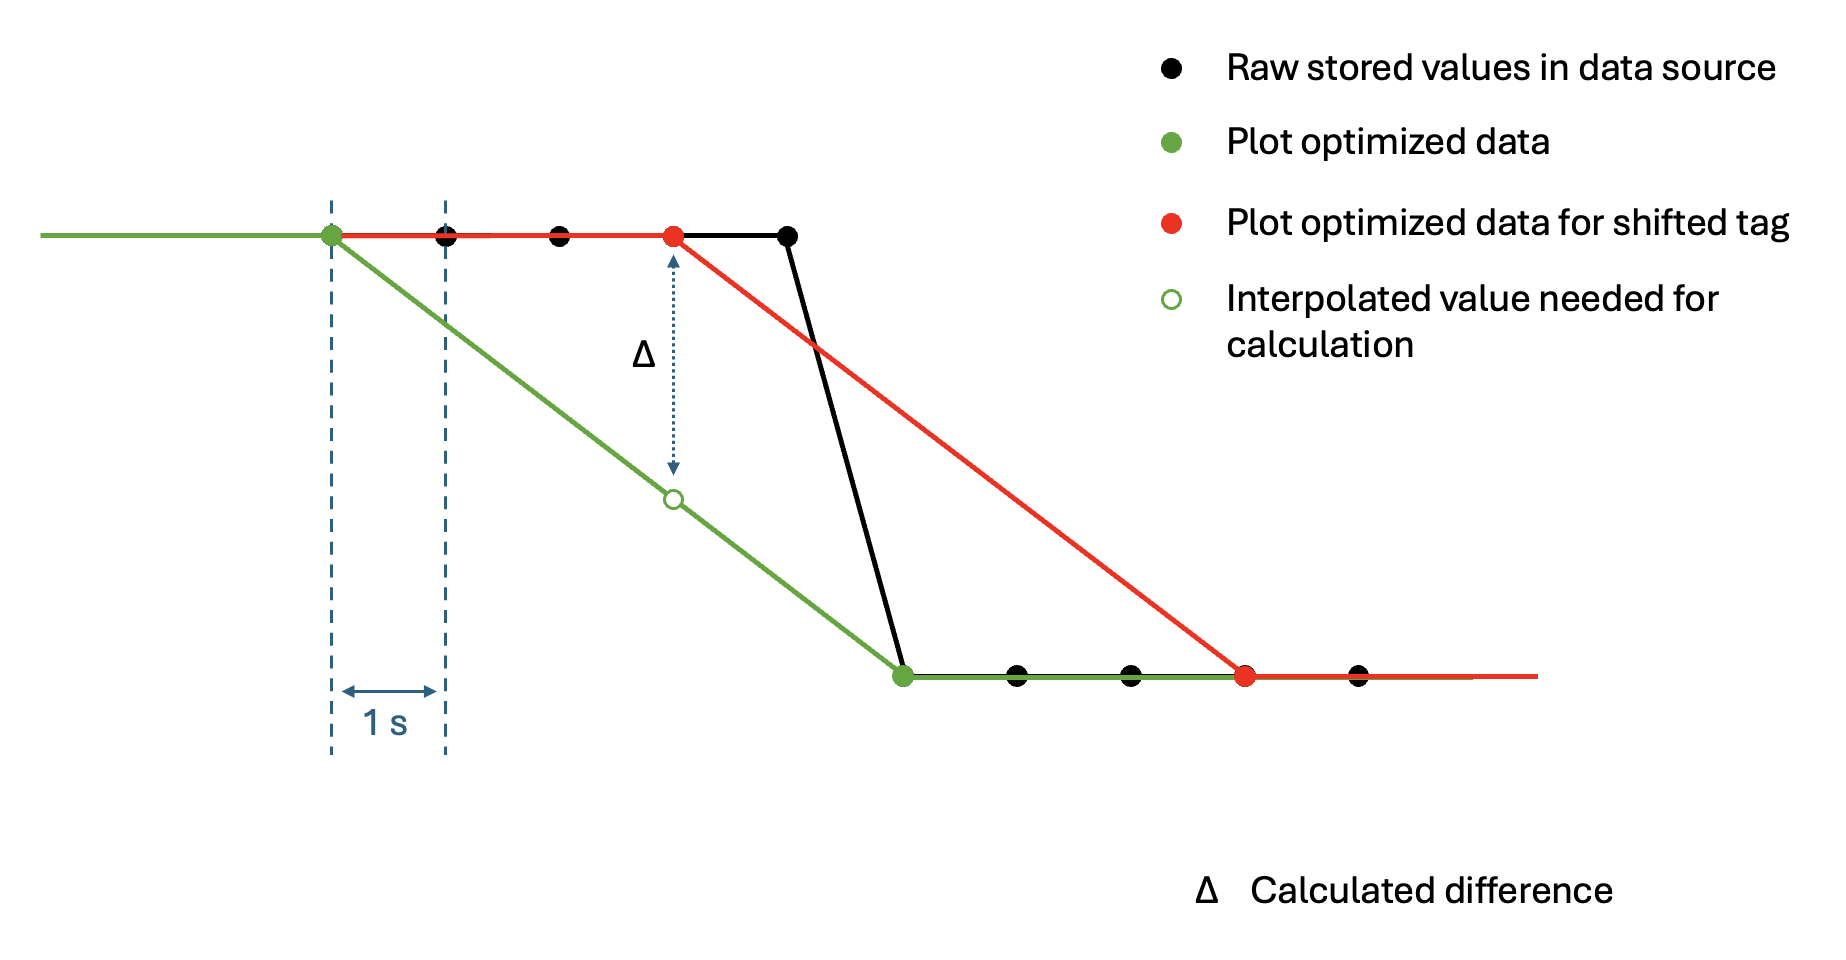
Each time you update the visualized window (for example, using the navigation arrows), different plot-optimized points may be returned, causing different interpolation values and calculated results. Only when you zoom in deeply (in this example, visualizing a 5-minute period) will the data source return raw data points, making the calculated value exactly match the drop.
When is this most noticeable?
This effect is most visible when;
Using small time shifts (seconds) relative to your data resolution
Viewing periods with rapid changes or sharp spikes
Working near the limits of your data resolution
Comparing formulas and aggregations (which use different time windows)
Recommendations
To get consistent and accurate results:
Use shifts equal to or larger than your data resolution
If your index resolution is 1 minute, use shifts of 1 minute or more
Avoid shifts of a few seconds when working with minute-resolution data
Zoom in for accurate small-shift calculations
For second-level shifts, zoom to periods where the historian selects data at that frequency
Be aware when comparing results
Understand that different zoom levels cause the historian to select different raw data points
Both results can be "correct" - they're just based on different points selected by the historian
Conclusion
These variations occur because different viewing windows cause the data source to select different raw data points for optimal plotting. TrendMiner then interpolates between these points, and when combined with time shifts, this can produce different calculated values. The results aren't "wrong" - they're based on different raw data points selected by the historian for different time windows. For the most consistent results, match your time shift size to your data resolution.
For more information about data resolution and indexing in TrendMiner, see the indexing section of the user guide.