Data scooter value changes when zooming in or out
Data scooter values may change when zooming in or out. This behavior can be explained by the fact that TrendMiner does not always use the same data points to calculate the value at a specific point on the chart.
TrendMiner interpolates data points to calculate the values where no real data is available. The more you zoom in, the more detailed the data becomes and the more fine-grained the data scooter values will be.
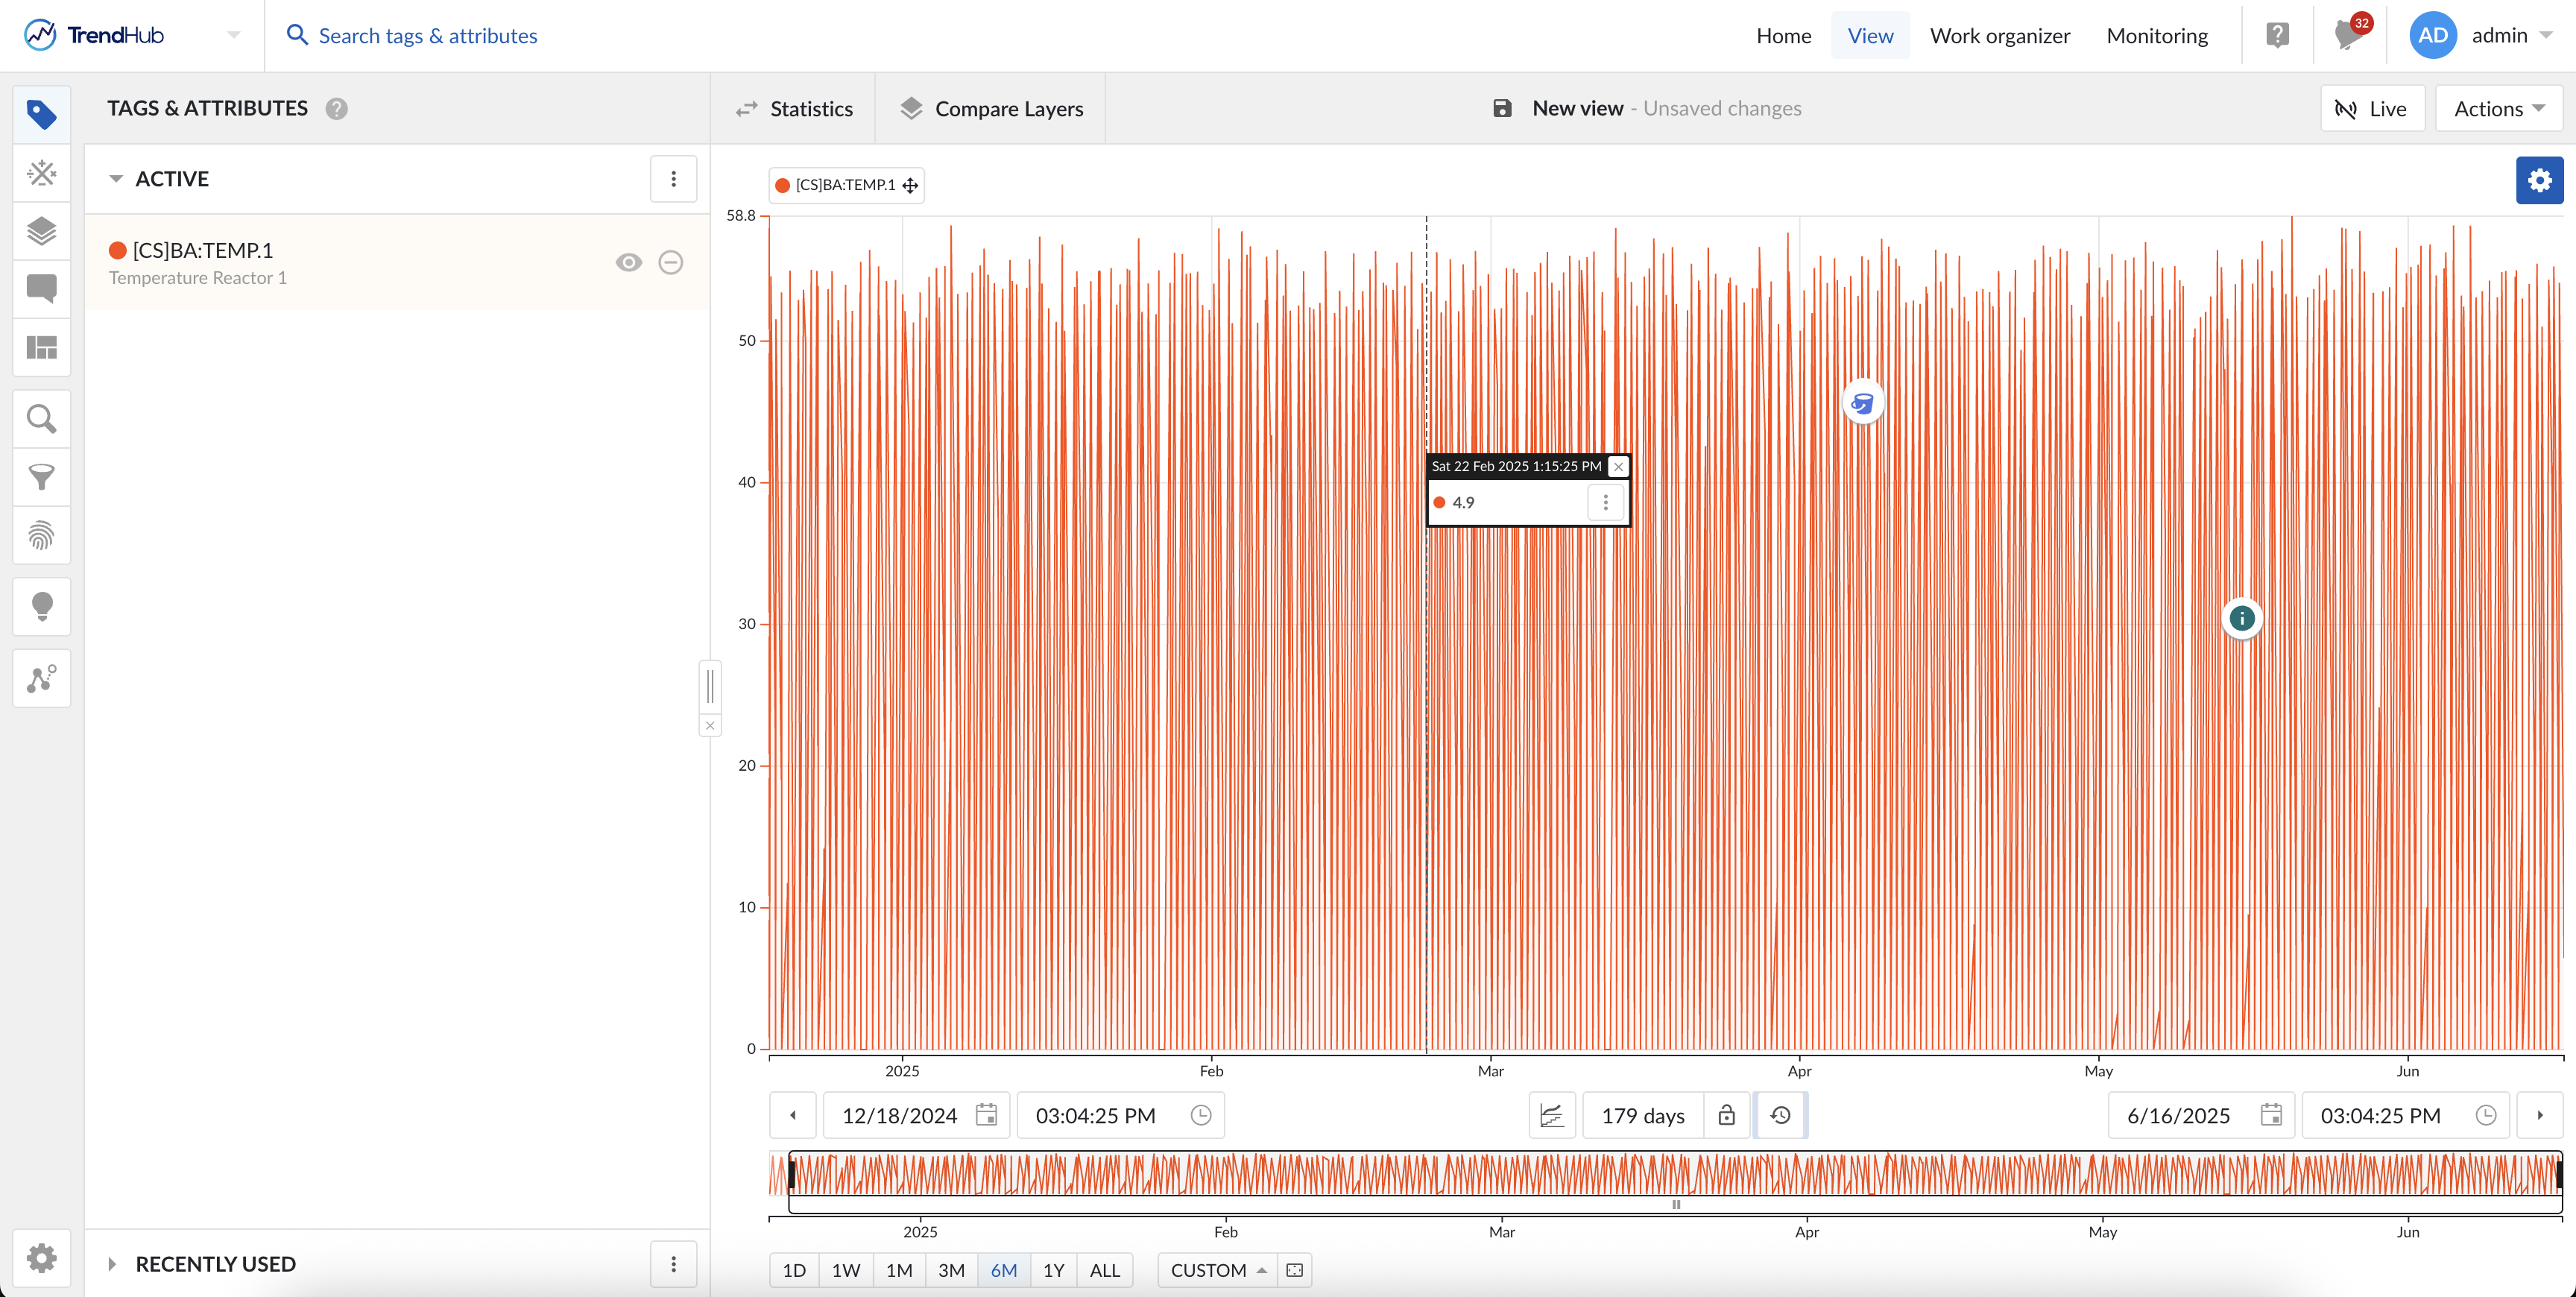
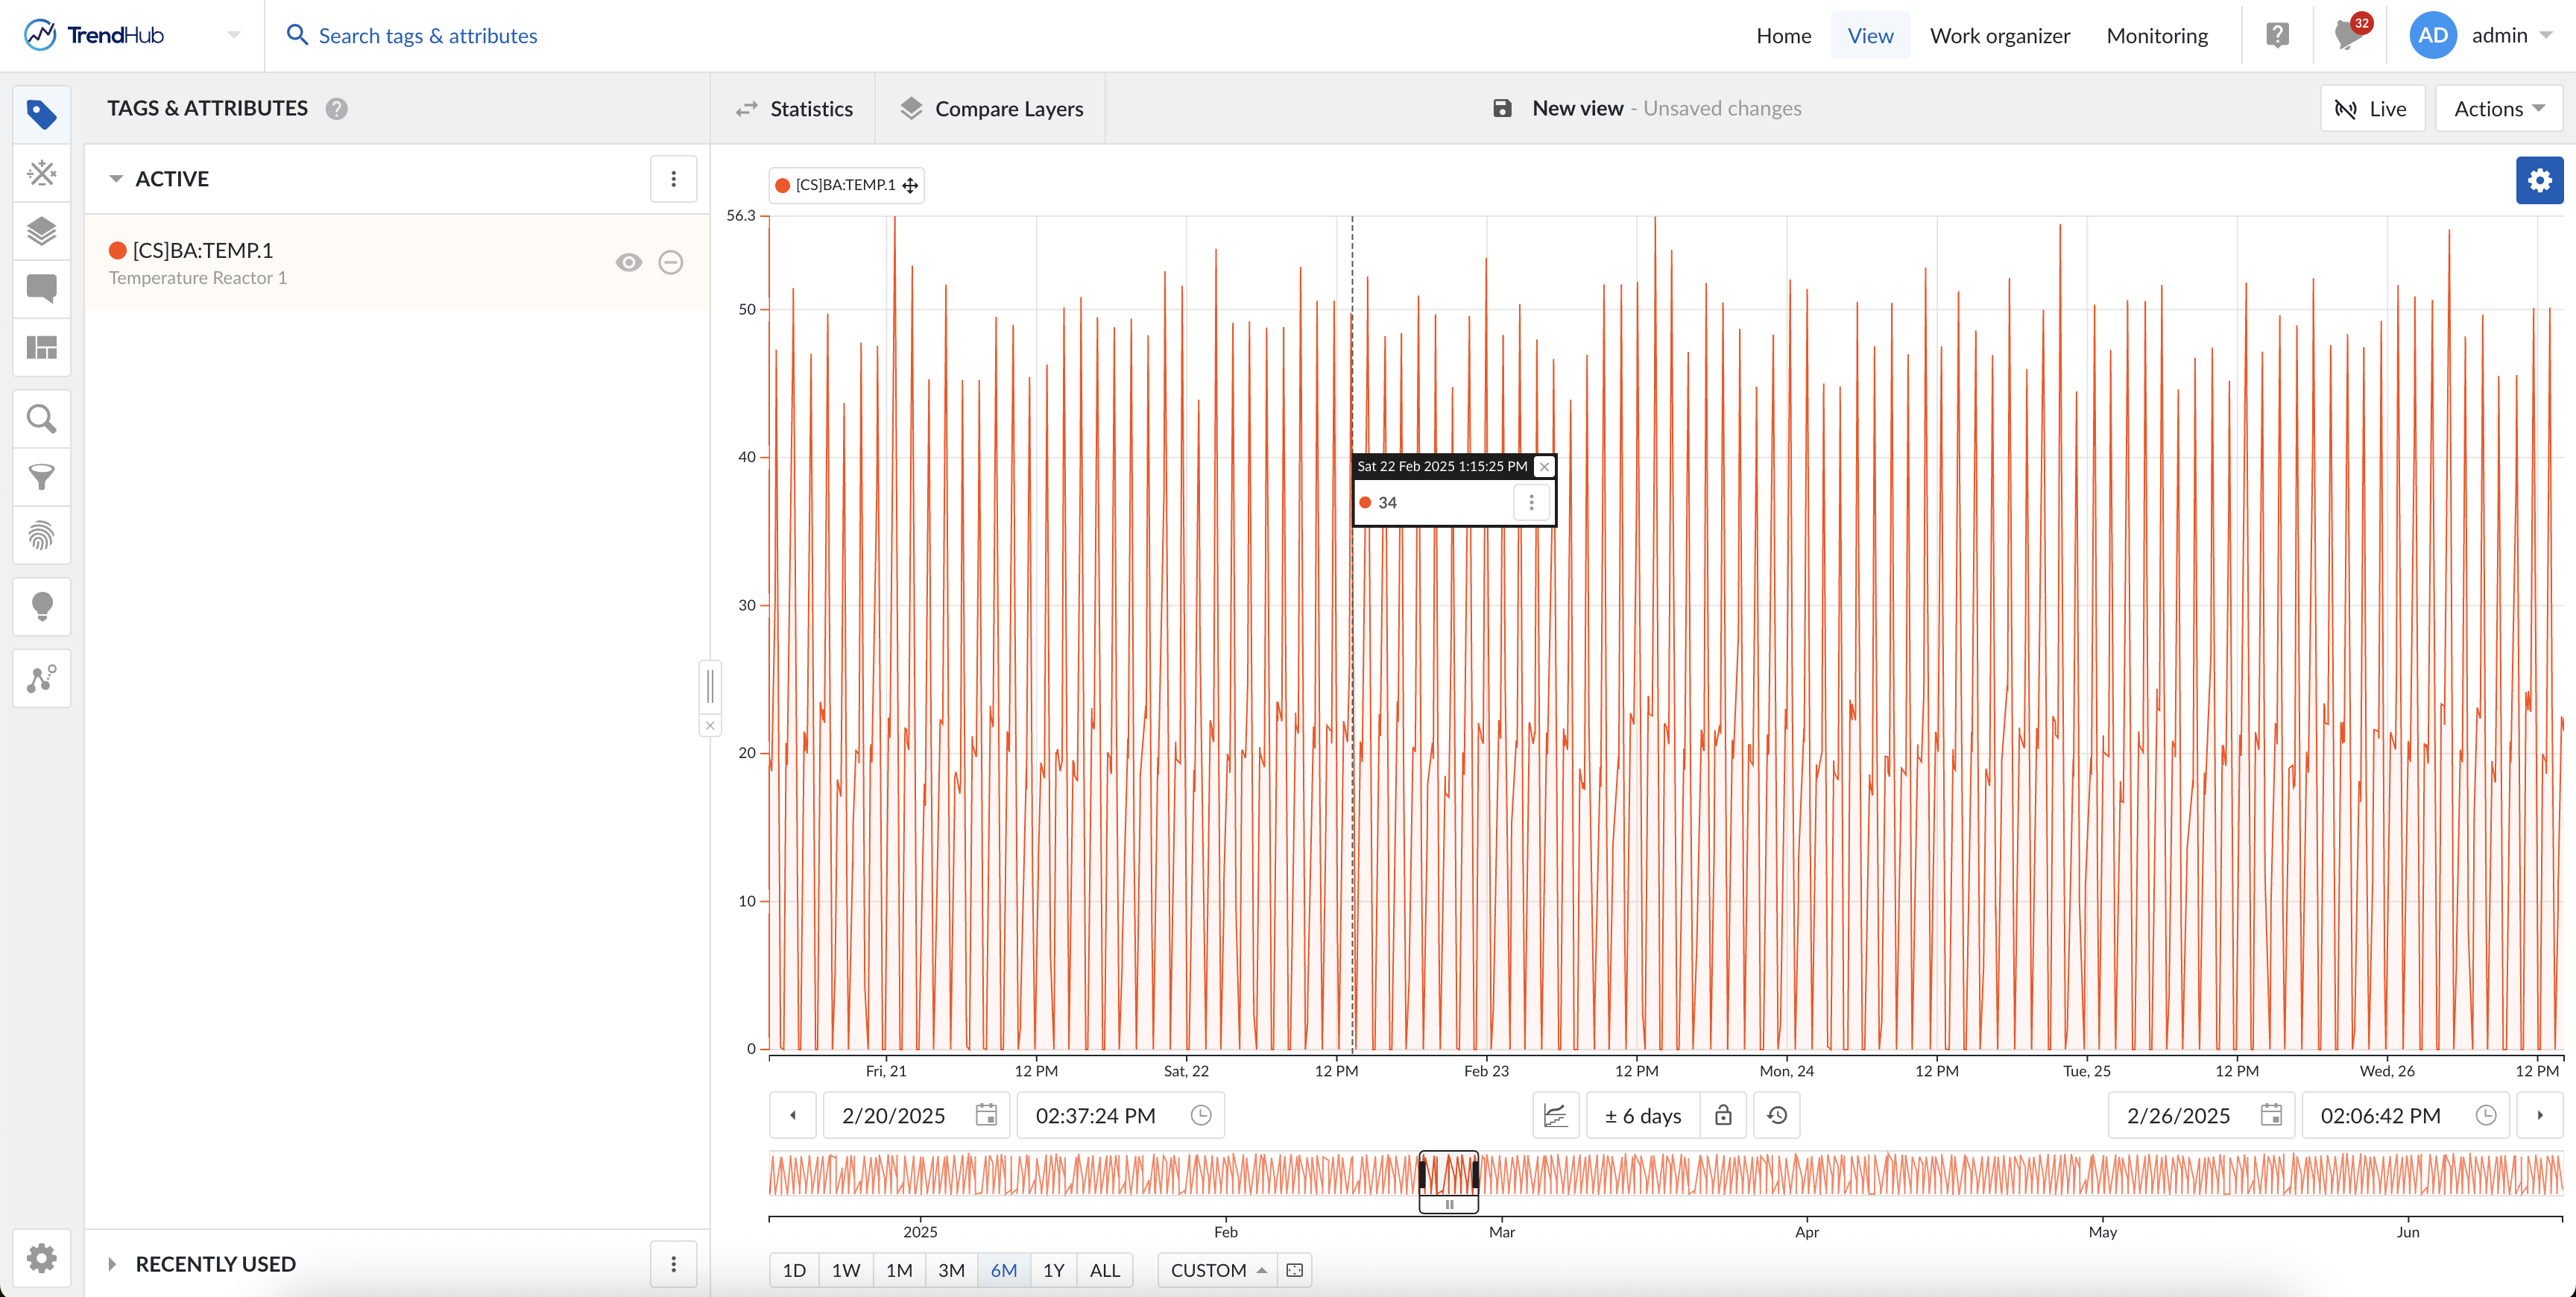
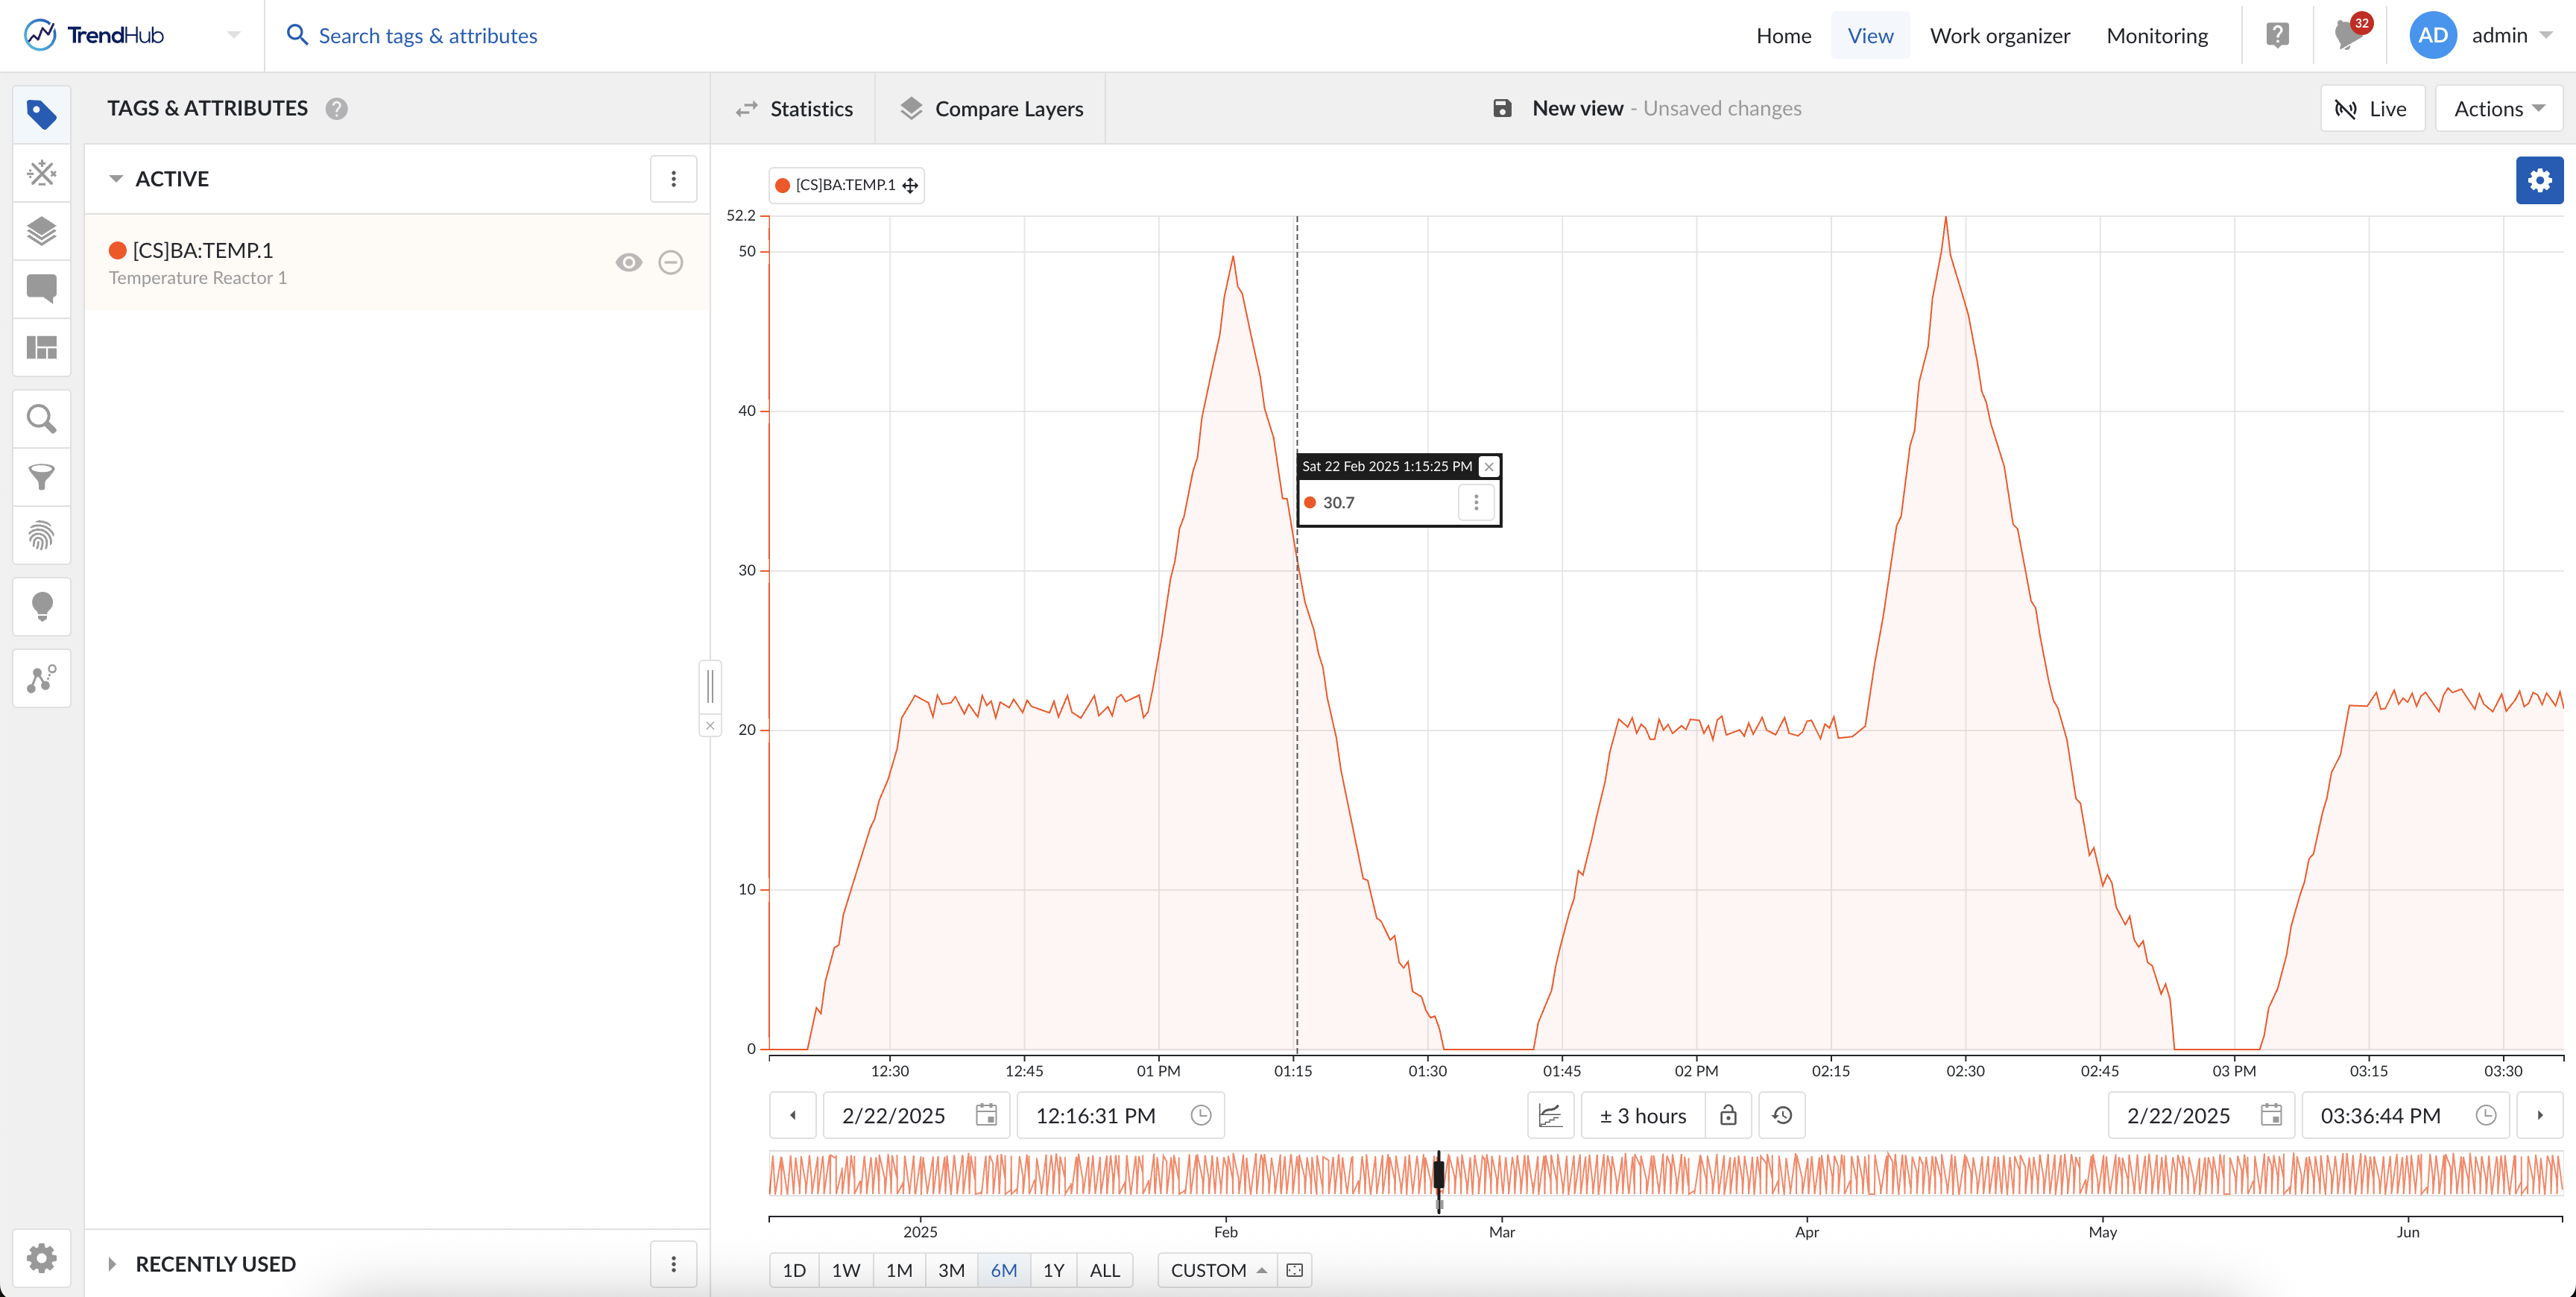
In the following example you can see that a tag has the following values on Febr. 22nd 2025, 1:15:25pm:
6M focus chart: 4.9
6d focus chart: 34
3h focus chart: 30.7
The following simplified overview clarifies this behavior:
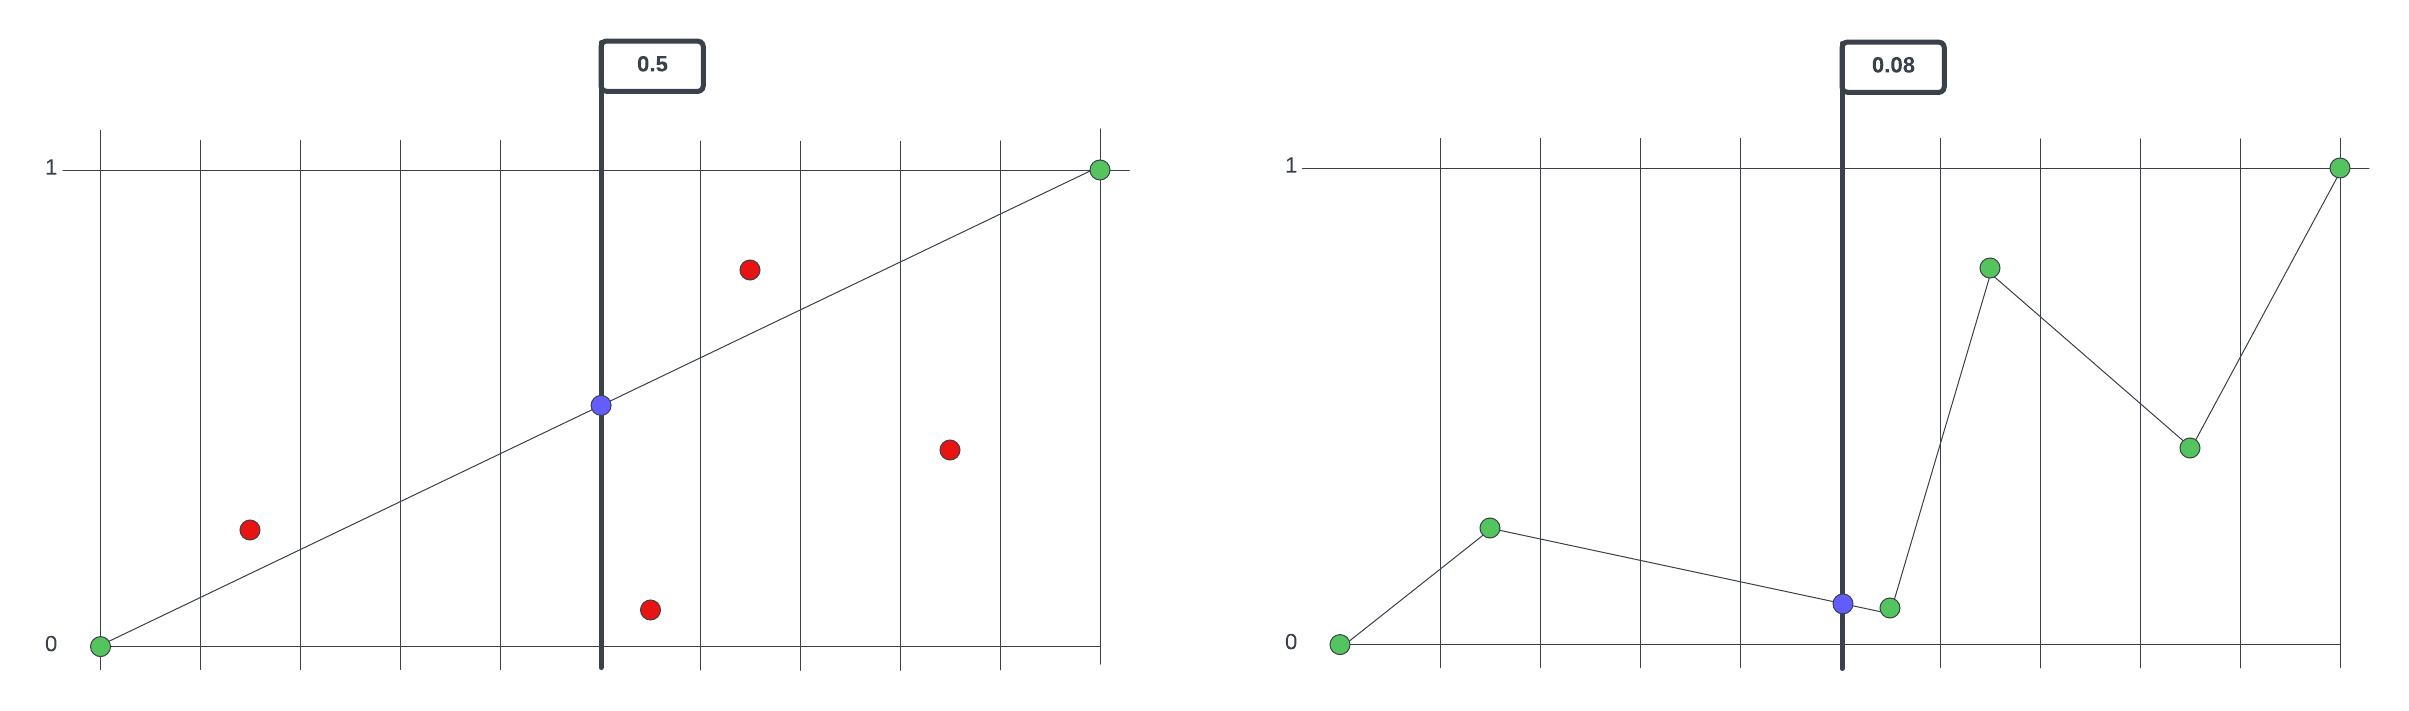
The left side represents a data scooter on a large timeframe. TrendMiner only uses the green data points and interpolates between these points to calculate the scooter value. In this case the data scooter will show a value of 0.5.
On the right side you see a scooter value of 0.08 which represents the value after zooming in. Because you zoom in, TrendMiner will use more fine-grained data points (all green points) and will interpolate between these which will result in a more fine-grained data scooter value.
This explanation oversimplifies how TrendMiner works but is intended to give basic insights in the behavior as seen in TrendHub.
Some other factors which can contribute to changing scooter values are:
data source types: different historians and different connectivity options in TrendMiner may support different aggregations which can influence the impact of zooming in and out on the data scooter values.
index resolution: the higher the configured index resolution, the more data will be available in the TrendMiner index to use on the chart. For most data sources TrendMiner will fetch live data from the data source when the user zooms in on a time frame below 300x the configured index resolution (5h for a 1 minute index resolution). Any charting on a higher time frame will be based on the index data.
This article is not intended to explain in full detail the exact behavior of the data scooter value calculation but instead aims at providing a basic insight. In case you believe this article does not explain the behavior you are seeing on your chart, please contact TrendMiner support for a more detailed explanation or investigation.
Related article: Why do values of calculated tags change when navigating on short time periods?