How to evaluate time series data source metrics
As soon as a new time series data source is connected, performance metrics will be collected regarding indexing calls, plot calls and synchronizations. This information is provided in the final tab of the data source overview tile. Plot and index calls are calculated based on information collected in the last hour*. Sync calls are based on the information collected during the last 24 hours. The metrics show 2 columns, providing a granular overview of the data flow between TrendMiner and the data source.
Note
*Since these metrics are calculated based on collected data within the last hour, optimization performed at the level of the data source can take up to an hour to become visible.
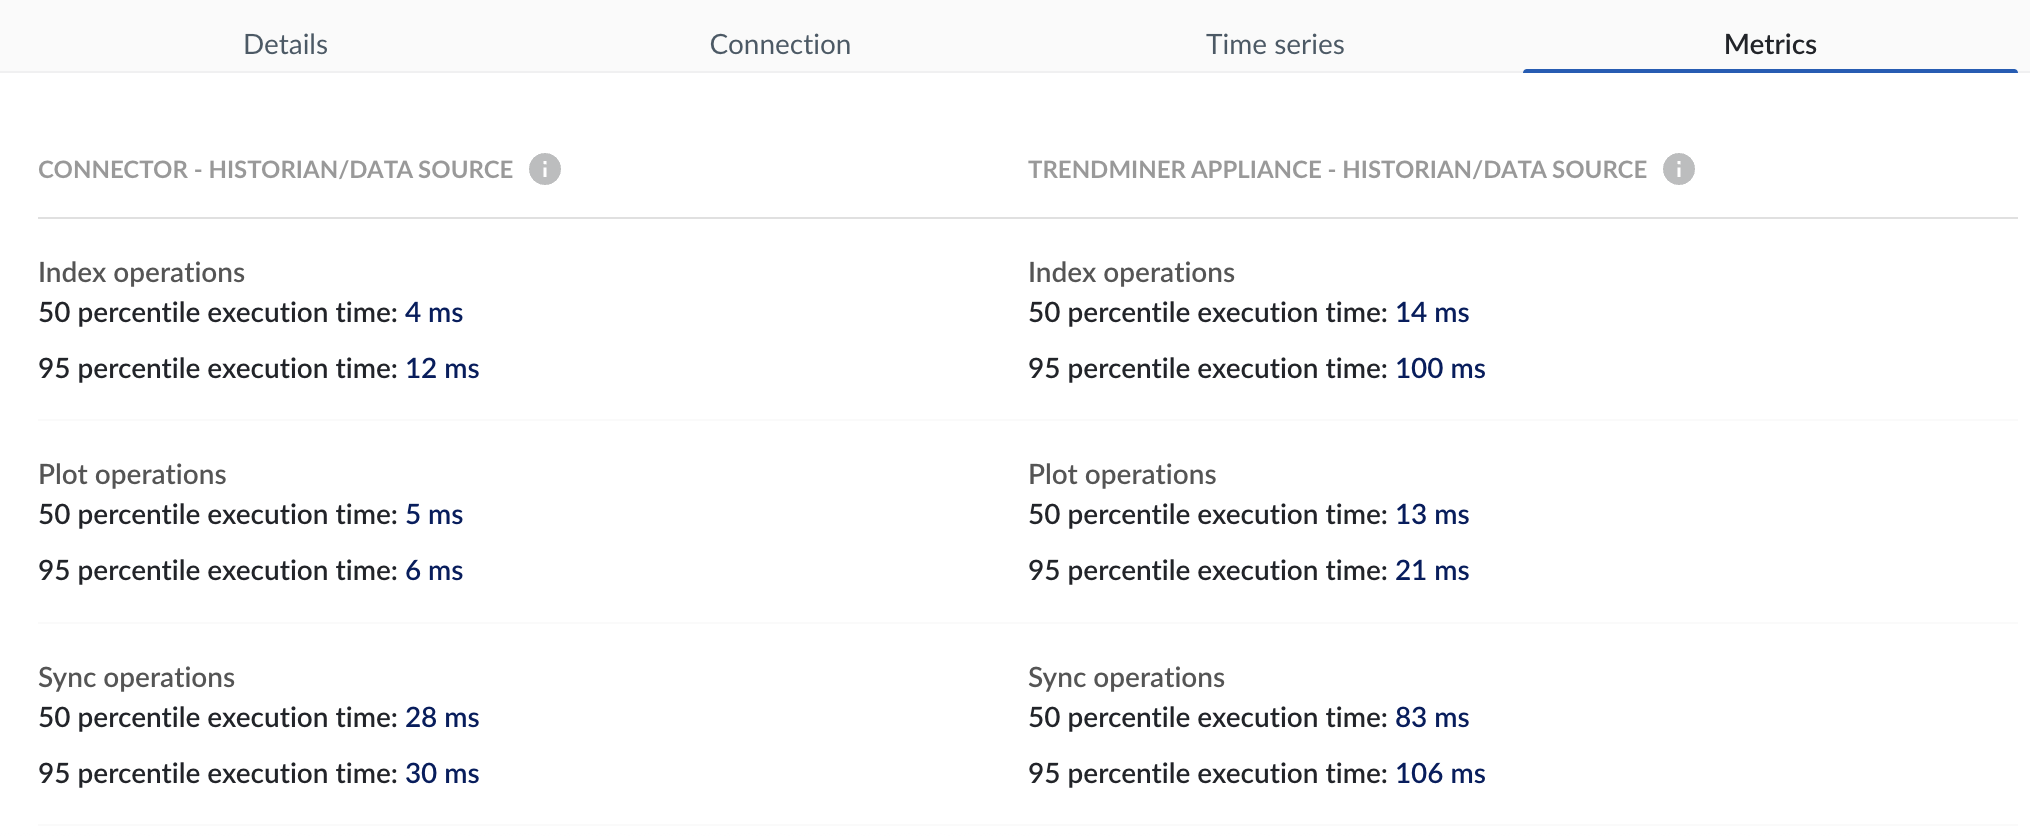
Connector - Historian/Data source column
The first column represents the most recent 50/95 percentile execution times of calls from the connector to the specific data source. In other words it shows how long it takes for the TrendMiner connector to receive a response from the data source when it sends out a request.
TrendMiner Appliance - Historian/Data source column
The second columns represents the most recent 50/95 percentile of calls total execution times from TrendMiner to your data source (data include the execution times from the connector to the historian). In other words it shows how long it takes for the TrendMiner appliance to receive a response from the data source when it sends out a request.
Note that if the data source is connected via a TrendMiner connector the timings from the second column include the timings of the left column and therefor will always be bigger.
Types of metrics
The metrics are split up based on the following types of data requests:
Indexing requests: all data request calls which are done by TrendMiner to build up the index for a tag.
Plot requests : all data request calls which are done by TrendMine to fetch live data for visualization purposes. These responses are not saved in TrendMiner and the requests are typically for smaller time periods. Live data can be disabled for a specific data source in which case no data is available for this specifc metric.
Sync requests: calls to update the list of available tags in TrendMiner. These calls only happen once every 24 hours by default and therefore these timings have minimal impact on the performance.
Identifying low performance
Expected timings are highly depending on the requested time frame. Unfortunately, the metrics do not distinct between small timeframes (e.g. 1 hour) or large timeframes (e.g. 1 month), which makes it challenging to identify a poor performing historian. However, overall we consider a good value to be under 1 second (for plot and index calls). Timings up to a few seconds are acceptable but timings above 10s could indicate performance issues. TrendMiner has some configuration options to mitigate the impact of a slow data source or to improve performance by tweaking the connection parameters but this depends on the type of data source. For a deeper investigation, please reach out to support via support@trendminer.com