Synopsis
Event Analytics and Parallel Coordinates plots
In previous versions of TrendMiner, search results in TrendHub could be analyzed on an aggregated level by using the Refinements options. In this release, the Refinements option has been replaced by Event analytics. Event analytics offers two visualization options: a histogram view and a parallel coordinates plot.
Both visualization modes can be used to provide ad hoc insights by evaluating how selections in one metric are reflected in the others. This allows you to test hypotheses or find possible root causes. Selections are automatically applied to all visualization modes which allows you to switch between the different graphs based on your needs.
Selections can still be applied on the search result list by clicking Refine. This will update the search result list based on applied selections, like the Refinements feature.
Accessing the Event Analytics pane
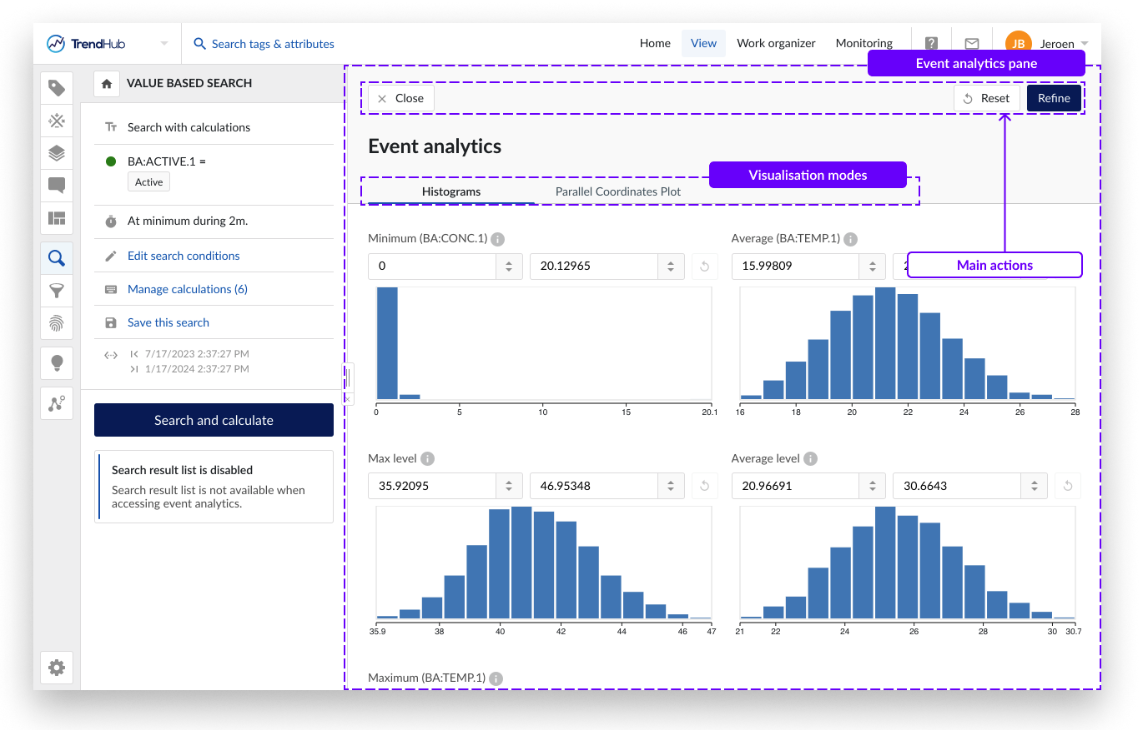
The event analytics pane can be accessed through the search result option menu.
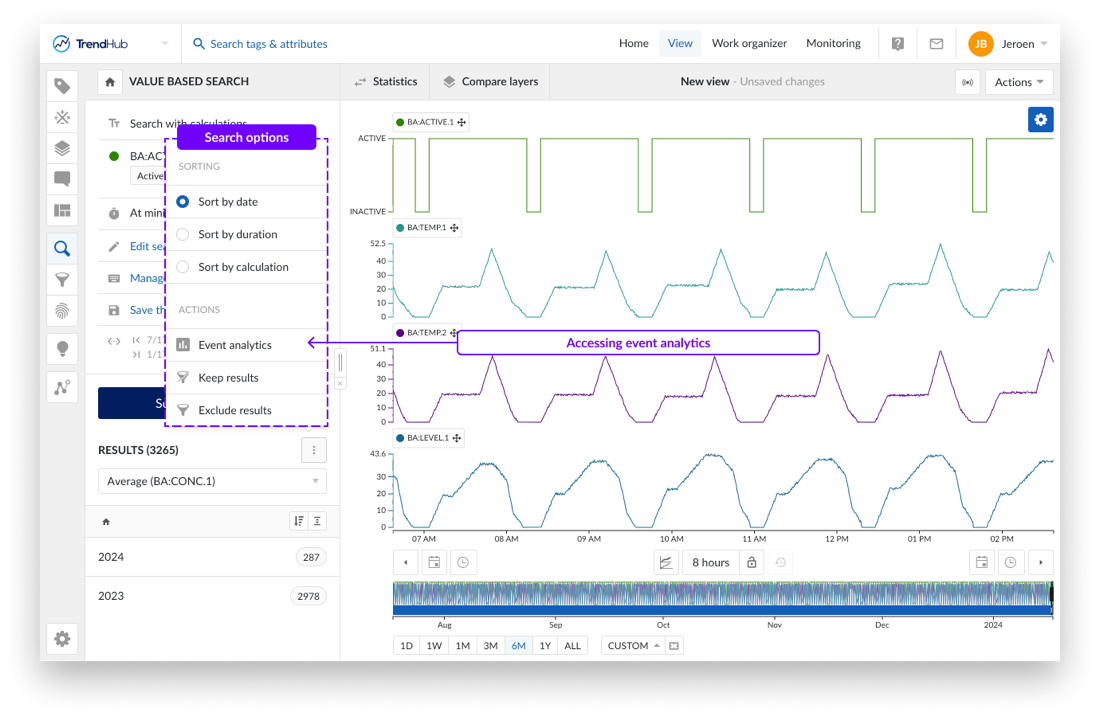
By default, the analytics pane will open on the Histograms tab. The histogram tab provides the same functionality as the Refinement feature. Screen real estate has been optimized to allow the analysis of all variables at once.
Switching to the Parallel Coordinates Plot
A parallel coordinates plot is a graphical method used for visualizing multivariate data. It can be assessed by using the tab switcher in the event analytics pane.
In contrast to the histogram visualization, the parallel coordinates plot shows every single search result as a continuous line. It consists of parallel axes, one for each metric (duration, similarity score and calculations on analog or discrete tag), and lines connecting the different axes.
This type of plot is particularly useful for understanding the relationships and trends within the search results. Look for patterns such as convergence, divergence, or parallelism of lines. These patterns can reveal correlations, clusters, or outliers in your data.
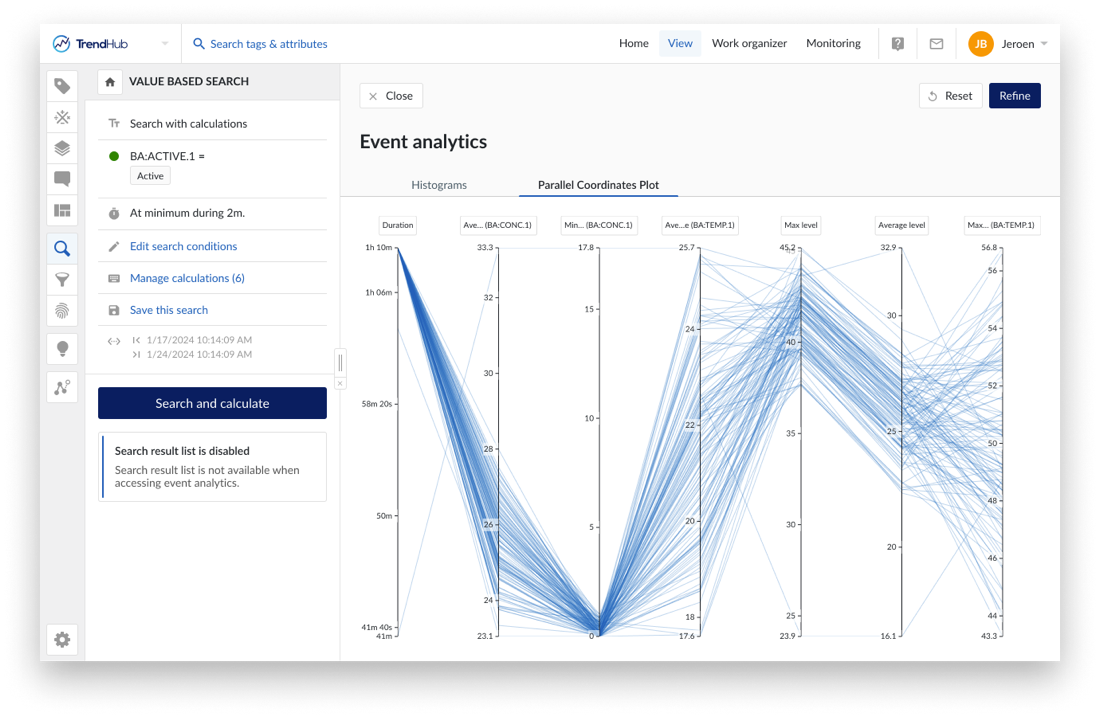
A subset of the data can be chosen by selecting on an axis (also called “brushing”). Remaining results are visualized in blue. Selections can be made on different axis to combine different criteria.
Applied (ad hoc) selections will be transferred when switching between the tabs. This allows you to iteratively select and analyze your data based on the visualization mode which is most suitable at any given point.
The reset button in the header of the event analytics pane will reset all applied selections on the histograms and parallel coordinate plot.
Refining results
The event analytics visualization can be used for ad hoc analysis or to further refine the search result list. Click Refine in the top right corner to transfer the ad hoc selections to the search result list. The search result list header will update to indicate both the number of refined results as well as the original total results.
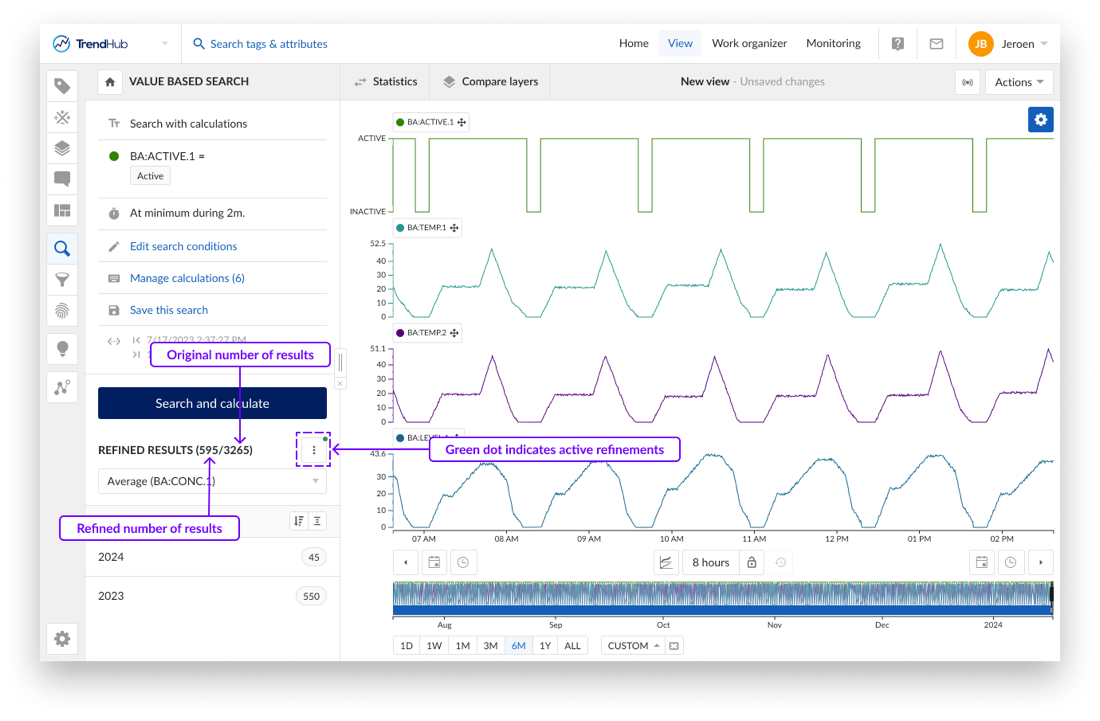
On re-opening the event analytics pane, selections will be re-applied based on the active refinements.
Eschbach Shiftconnector®
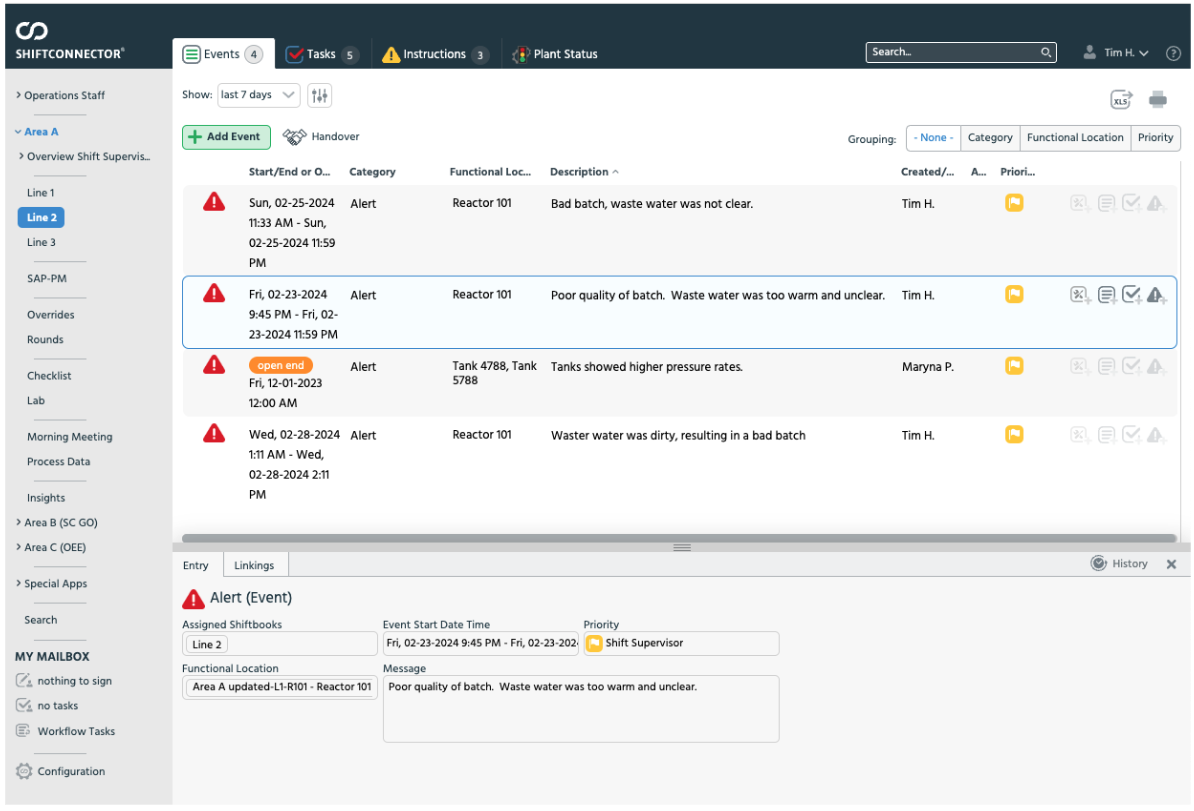
Shiftconnector® from Eschbach is the leading Plant Process Management solution to organize teams & their tasks. It contains a suite of digital applications for shift handover, team communication, production management and regulatory compliance.
Shiftconnector® makes it straightforward to register events like alerts and quality issues by shift operations teams. These events are helpful during investigation and to correlate sensor data during analysis.
Shiftconnector® - Event view
With the Plug ‘n Play integration within TrendMiner, the registered Shiftconnector® events are pulled in and converted into context items. This removes the need to manually recreate them or navigate through two platforms simultaneously during analysis.
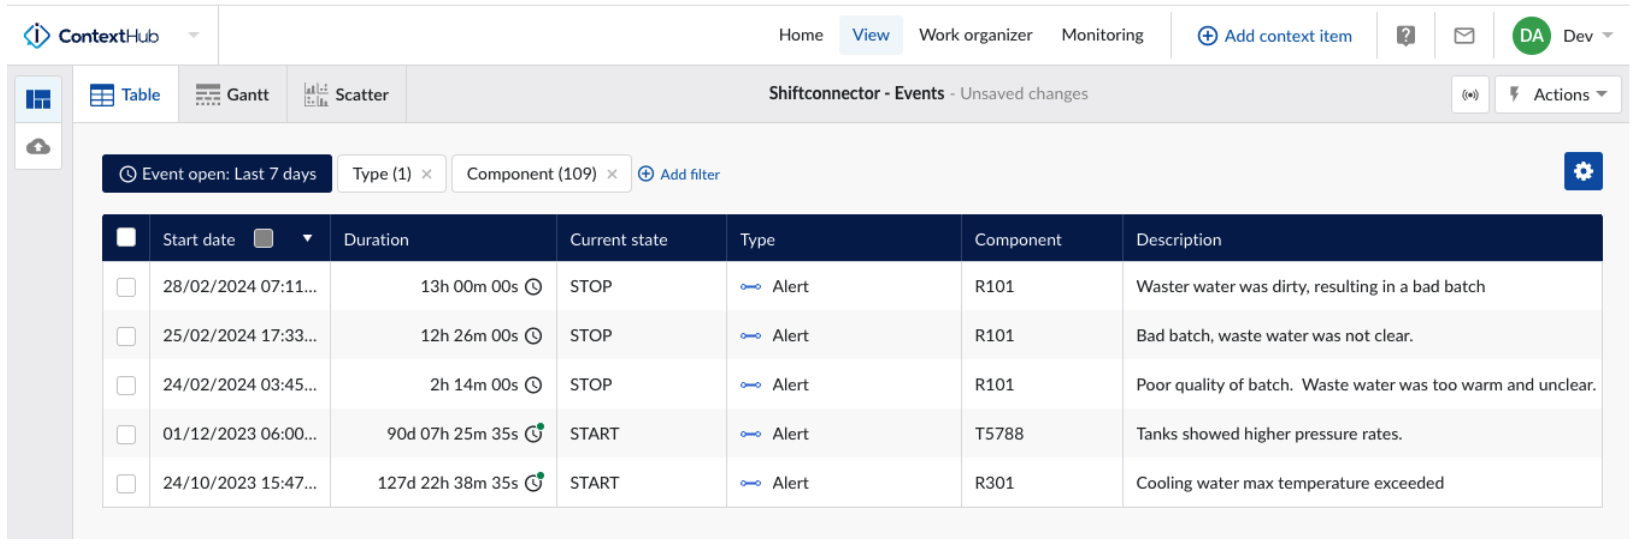
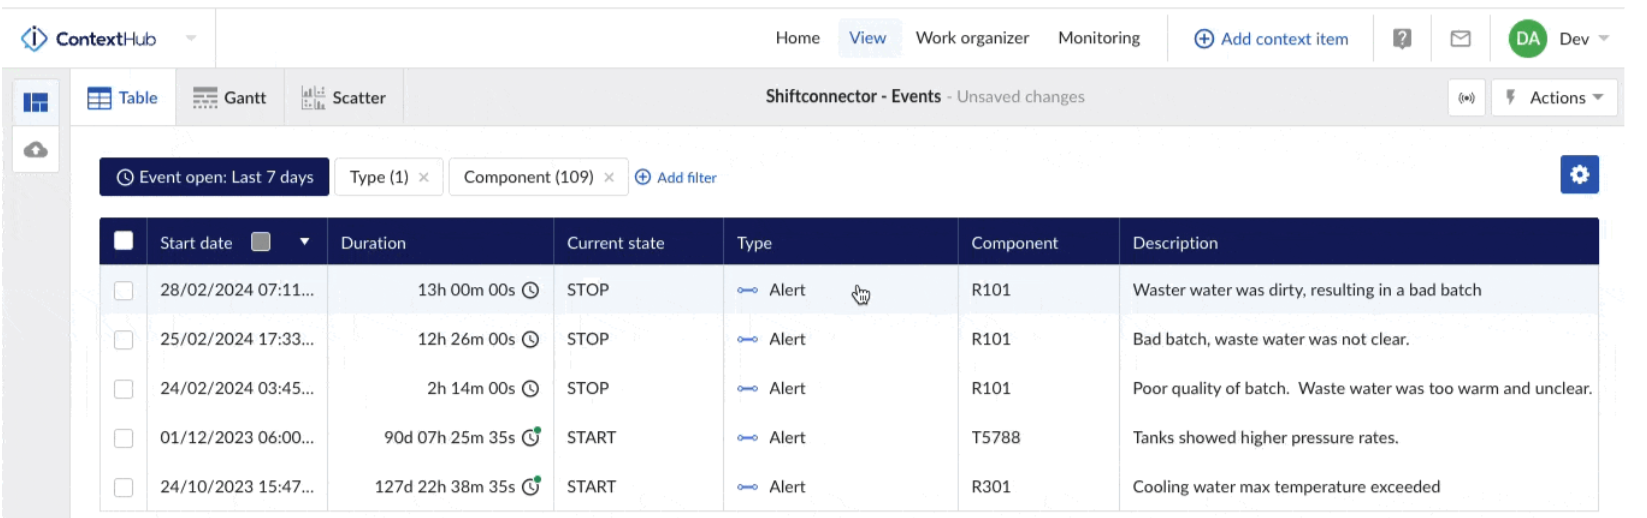
Shiftconnector® event as a TrendMiner Context item
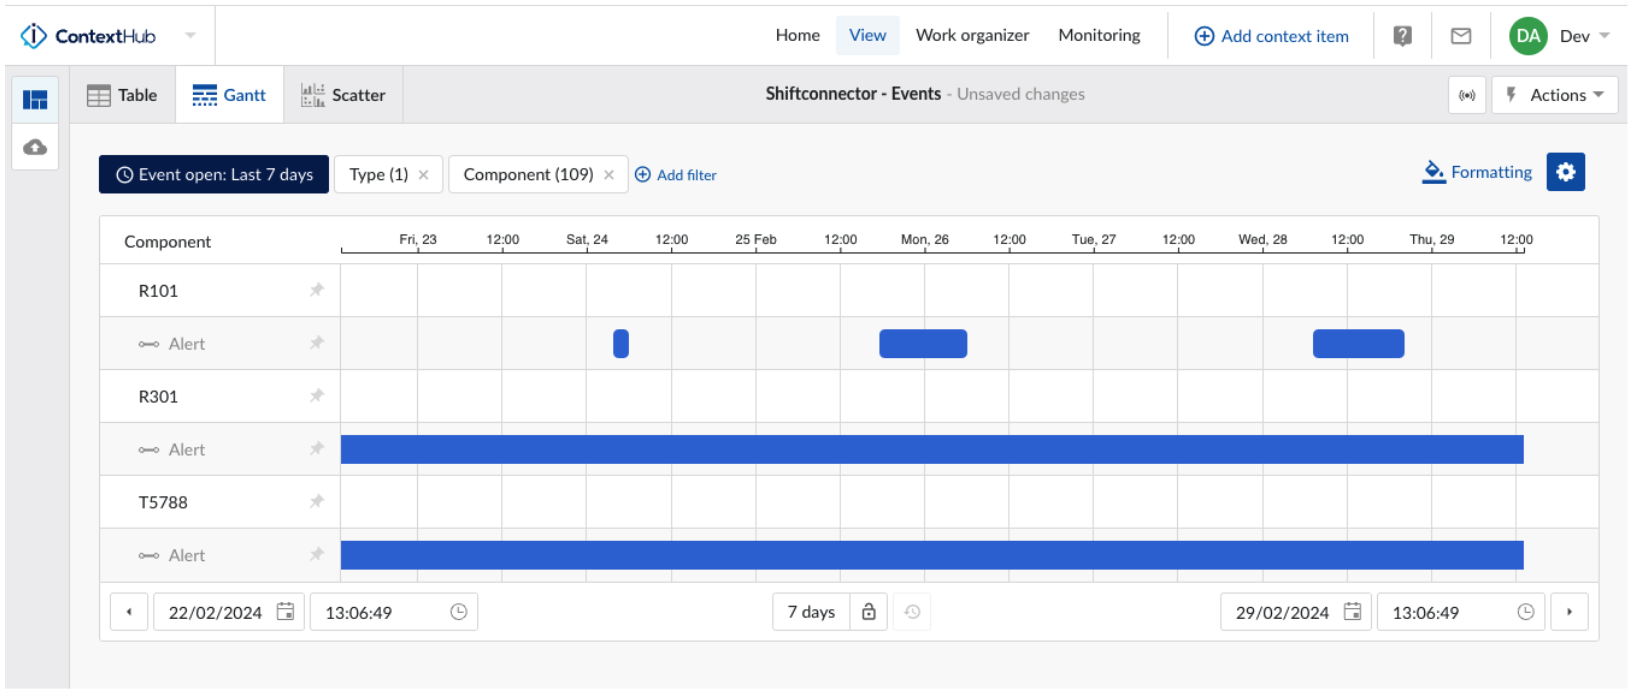
Shiftconnector® event as a TrendMiner Context item visualized in Gantt format
From the context view, the events can be selected and easily opened in TrendHub to investigate time series data related to the reported event.
Version support: TrendMiner supports Shiftconnector® versions from 7.15 to 7.19.
As of 2024.R1.1: Custom Calculations
In the 2024.R1.1 release the custom calculation feature will be made available to licensed expert users. This additional option in the tag builder enables you to create new TrendMiner tags based on a custom developed Python script. This will allow you to go beyond the standard tag manipulation capabilities of TrendMiner facilitating additional use cases. Once created, these tags can be displayed and analyzed as any other tag in TrendMiner.
The configuration flow of a custom calculation will be set up to enable easy iteration cycles during the development of the script. This will be achieved by providing a dedicated code editor and preview mode.
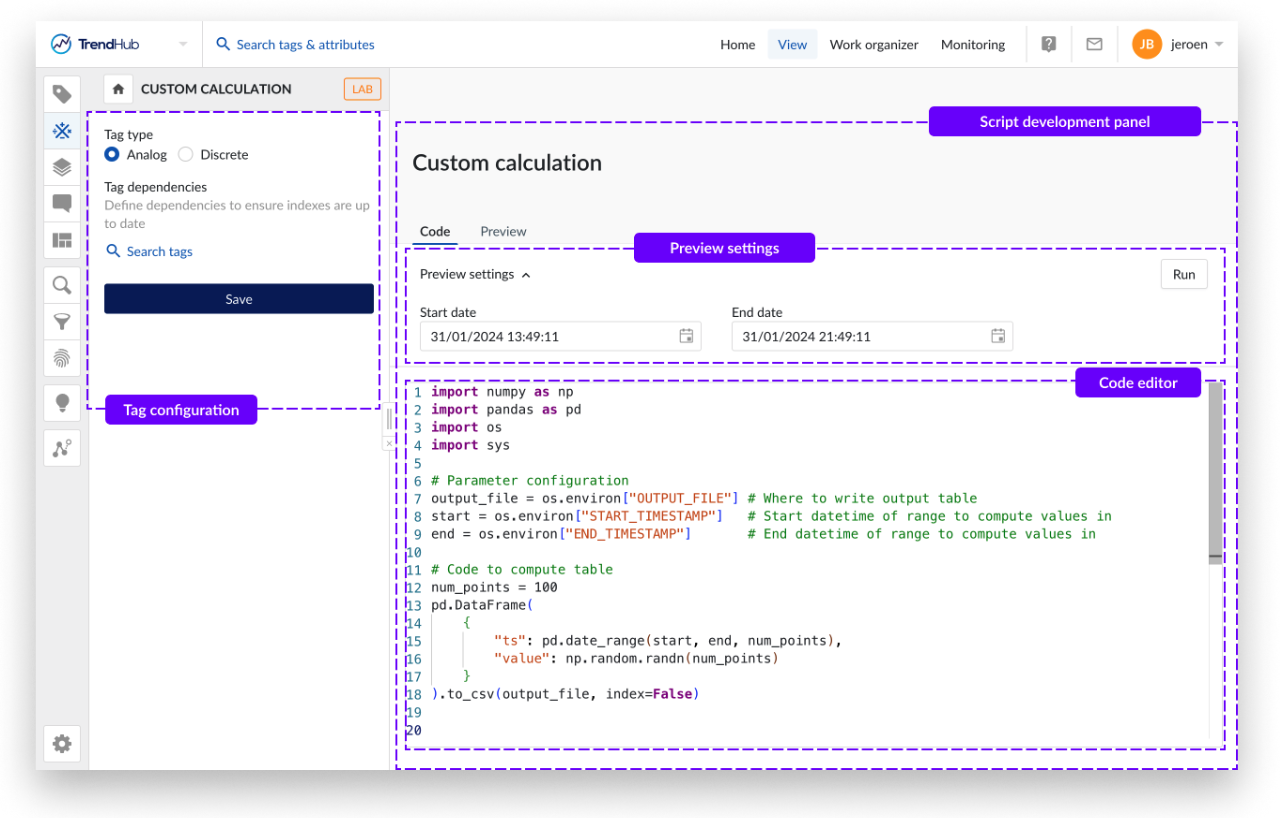
Your custom Python script can be copied into or created from scratch in the editor on the code tab. The run button on the right side can be used to execute the current script and will automatically open the preview tab.
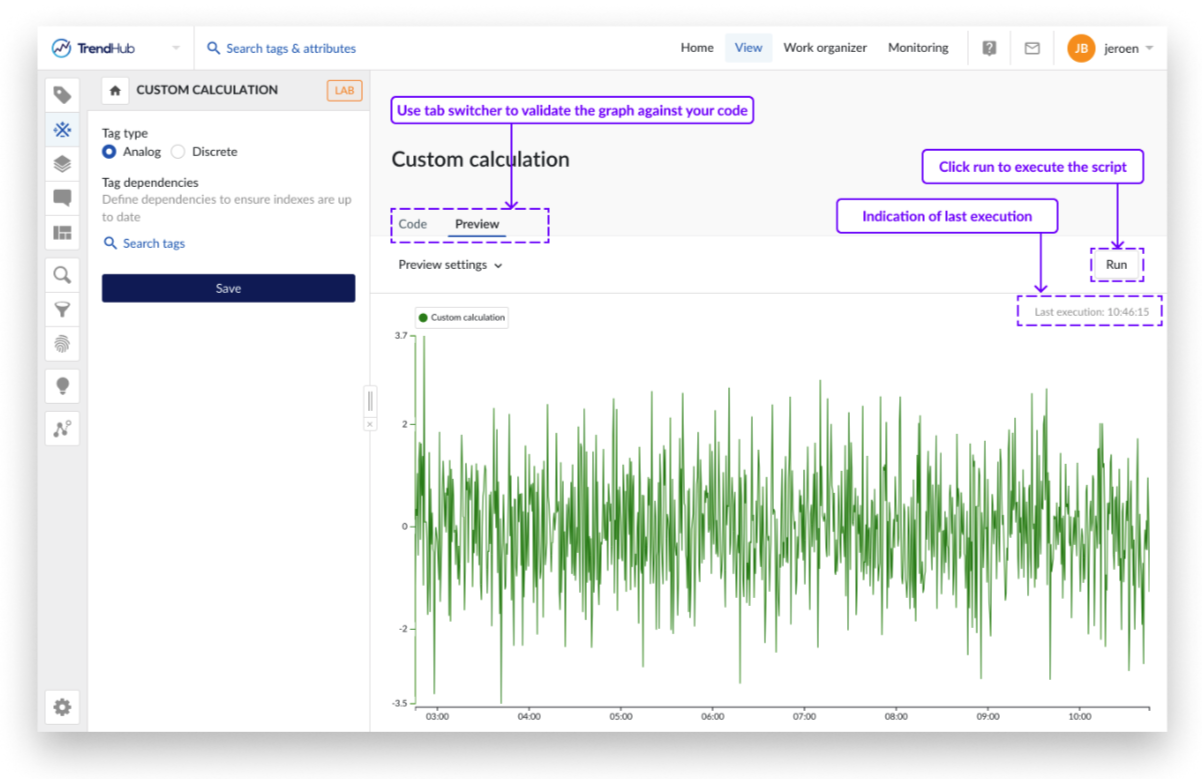
You will be able to freely switch between the code and the preview tab to make changes to the script and test the output on a specific preview window. Once you are happy with the output, you will be able to save the tag, after which the tag will be indexed like any other tag within TrendMiner. All TrendMiner users will be able to use these tags in their further analyses, providing they have access to the underlying historian tags.