Diagnostics
This section allows administrators to monitor the synchronization status of context-capable data sources. Both live and historical sync can be enabled under data sources, and their status can be viewed in detail here.
Live synchronization, if enabled, focuses on keeping the context items in TrendMiner aligned with the state of the event frames in the data source. It processes incoming event frames sequentially, following a "first in, first out" principle.
Excessive interval sync is automatically triggered by live synchronization when a large number of event frames are received in a short period. This bulk update is isolated from the live sync queue and processed in parallel.
Historical synchronization synchronizes event frames from a specific time interval in the past and runs in parallel with both live sync and excessive interval sync. Historical sync need to be triggered manually from ConfigHub.
Event frame synchronization is driven by the last modified date of the event frames, ensuring that changes are always picked up, even if the event occurred outside the synchronization interval.
Additionally, automatic cleanup processes, such as the nightly cleanup and resync of context items, run in the background.
For every context capable data source with live synchronization enabled, TrendMiner will periodically check the data source for new/updated event frames. All event frames created or updated between the last check and the present moment will be picked up for synchronization. The application keeps track of synchronization progress, so even in case the synchronization is interrupted (e.g. due to connection issues), it will continue where it left off after the issue has been resolved.
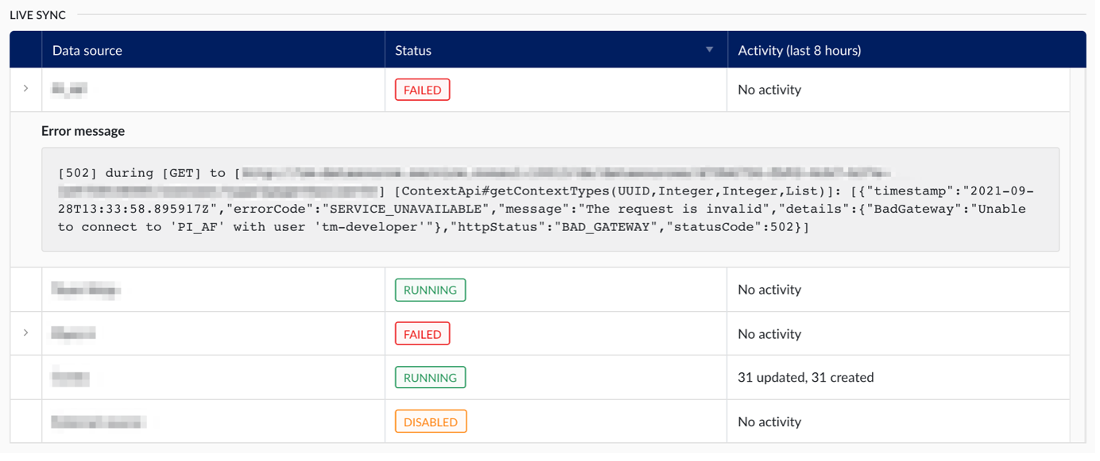
In case the live sync runs into a hard exception (e.g. the data source cannot be reached, and no event frames can be retrieved), it will receive the “Failed” status and an exception message can be made visible by clicking the arrow in the left-most column.
Errors when processing single event frames will not result in a failed status, these events will simply be skipped, and tracked as part of the failed context items section.
The excessive interval sync gets triggered automatically when the live sync detects a large amount of event frames in the same synchronization interval. The threshold for excessive interval sync is set to 800 event frames per interval, and once this is reached the entire interval will be isolated from the live sync and processed in parallel. This to avoid delaying the next interval of the live sync, due to the processing time required for the large amount of event frames in the current interval.
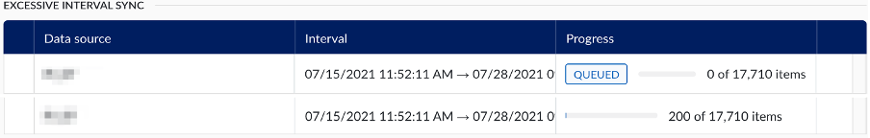
The table keeps track of a full historical overview of all excessive interval synchronizations that have occurred. For each one, the following information is made available:
Data source: The data source for which the need for an excessive interval sync was detected.
Interval: The time interval during which the need for an excessive interval sync arose.
Progress: The progress column combines the status of the synchronization with a progress bar. The following statuses are possible:
Queued: In case too many excessive interval synchronizations are already running, additional ones will be queued until resources are available to pick it up.
Failed: The excessive interval sync encountered a hard exception, resulting in some or all event frames not being processed. The interval synchronization can be retried by clicking the retry icon in the right-most column of the table (only visible for failed rows). The exception encountered can be shown by clicking the arrow in the left-most column.
Done: The excessive interval sync has completed successfully. All event frames were either processed successfully or have been added to the list of failed context items.
A historical sync can be requested on-demand by administrators, for context capable data sources, by selecting the desired data source in the table and starting the historical sync for a specified interval in the past. The result is a full resynchronisation of all event frames modified during this period.
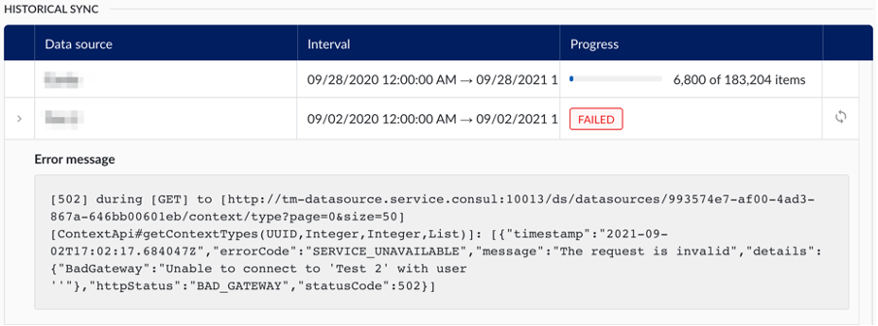
The table keeps track of a full historical overview of all historical synchronizations that have occurred. The information available in the table is the same as for the excessive interval sync, including the possibility to retry failed synchronizations.
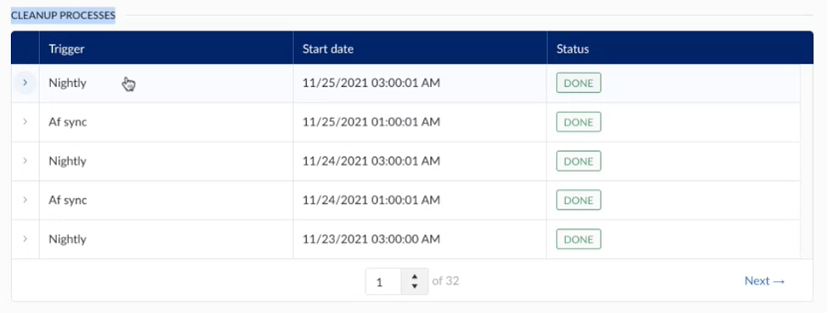
There are two automatic triggers for cleanup processes: the nightly cleanup, which runs every night, and the automatic resync of items without a component, triggered after an AF sync finishes.
Nightly sync
The automatic nightly resync of open items appears as an active job on the diagnostics screen once it starts. Every night, the system checks for context items that have been open for more than 24 hours, meaning they have a start date but no end time, indicating they are still open.
Items open longer than 24 hours may suggest the start event was successful, but an issue occurred during the closing event, preventing the context item from closing properly.
During the nightly cleanup, context items that should be closed will be updated. If they are not closed, they will remain open until an end event is received from the source.
Note
Nightly syncs run automatically by default. If needed, you can trigger a manual cleanup from the data source settings in ConfigHub. For more details, refer to the "Data Source" section above.
AF sync (Asset Framework)
A cleanup process for context items is triggered when either an AF sync, started from asset-capable data sources in ConfigHub, or an AF import, initiated by TrendMiner admins in ContextHub, completes successfully.
When assets are added or removed from the source AF, the AF sync identifies the differences and updates the TrendMiner AF accordingly. This triggers an automatic resync of context items without an associated component, which will appear as a scheduled job in the diagnostics screen.
Note
To add an AF sync, look to the "Asset data" section above.
In case an event frame fails to process correctly, and the corresponding context item cannot be created or updated, it will be added to the table of failed context items.
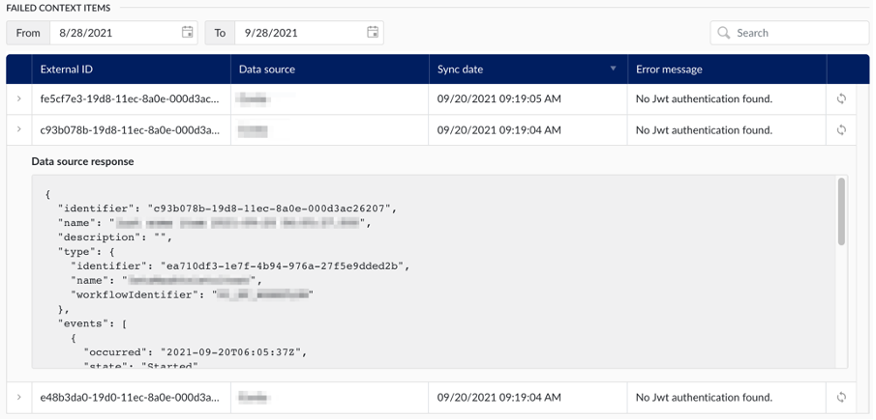
The table keeps track of a full historical overview of all such failures, and for each one the following information is made available:
External ID: The ID of the corresponding event frame, in the source system.
Data source: The data source in which the event frame resides.
Sync date: The time on which the synchronization last occurred (and failed).
Error message: The error message encountered at the time of failure.
Additionally, the table offers has two additional features:
View data source response: By clicking on the arrow in the left-most column, the administrator can view the payload that was received from the data source.
Re-process event frame: By clicking the retry icon in the right-most column, the application will try to reprocess the event frame, potentially resolving the failure.
The “asset framework sync” section of diagnostics page in the data section of ConfigHub allows administrators to effectively monitor the synchronization status of asset capable data sources.
The history table keeps track of the full history of asset framework synchronizations.
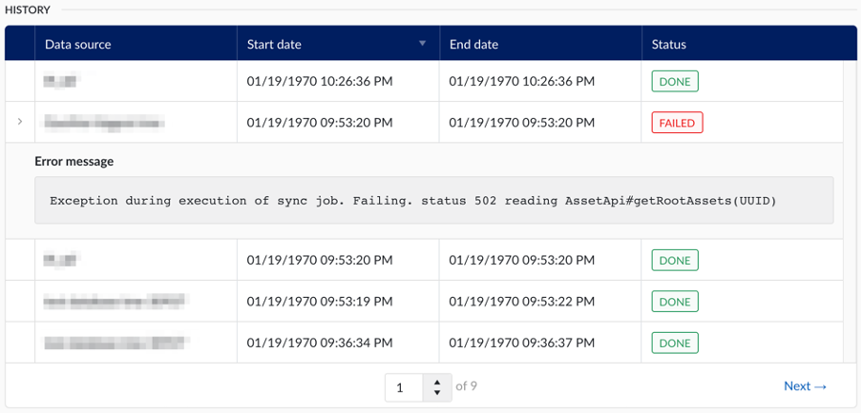
The following information is available to the administrator:
Data source: The data source from which the asset structure was synchronized.
Start date: The date and time on which the synchronization was started.
End date: The date and time on which the synchronization concluded.
Status: The final status of the synchronization
For failed synchronizations, an error message can be viewed by clicking on the arrow in the left-most column of the table.