How to write your own time series data connector: step-by-step quick start guide
Building a custom time series connection? Connect your data archive, whether it’s a Historian, IoT Platform, or Data Lake, to TrendMiner with the Connector API.
TrendMiner supports different data types and out-of-the-box connectivity options. If the standard connectivity options do not cover your needs, you can develop your own so called 'custom connector' which allows you to translate your data into a format which is accepted by the TrendMiner appliance and makes your data available in TrendMiner for analysis.
This article describes the minimal steps to take to get your time series data source connected to TrendMiner. It's a quick start guide with a focus on getting the first results as soon as possible. Further optimisations to your implementation might be required after implementing these first steps.
The following steps are covered:
Set up and add your connector to TrendMiner
List your provider
List your data sources
Make tags available in TrendMiner
Provide tag data
Set up and add your connector to TrendMiner
When this step is done you will have a custom connector up and running and successfully connected to TrendMiner.
You can implement your custom connector with your preferred technology. The standard TrendMiner connector is a .NET application, deployed in Microsoft IIS, but other options can be Java, NodeJS, … deployed standalone or to the cloud e.g. AWS Lambda, Azure functions, …
To get to an MVP (minimal viable product) version of your connector a few REST API endpoints need to be implemented. The first REST endpoint to implement is:
GET /api/version
Example output:
{
    "version": "1.0.0"
}
Which version your connector returns is up to you. You can use the versioning to keep track of your connector updates. TrendMiner only uses this information to display in ConfigHub. After this endpoint is implemented you can add your connector to TrendMiner via ConfigHub (check the user documentation to find out how).
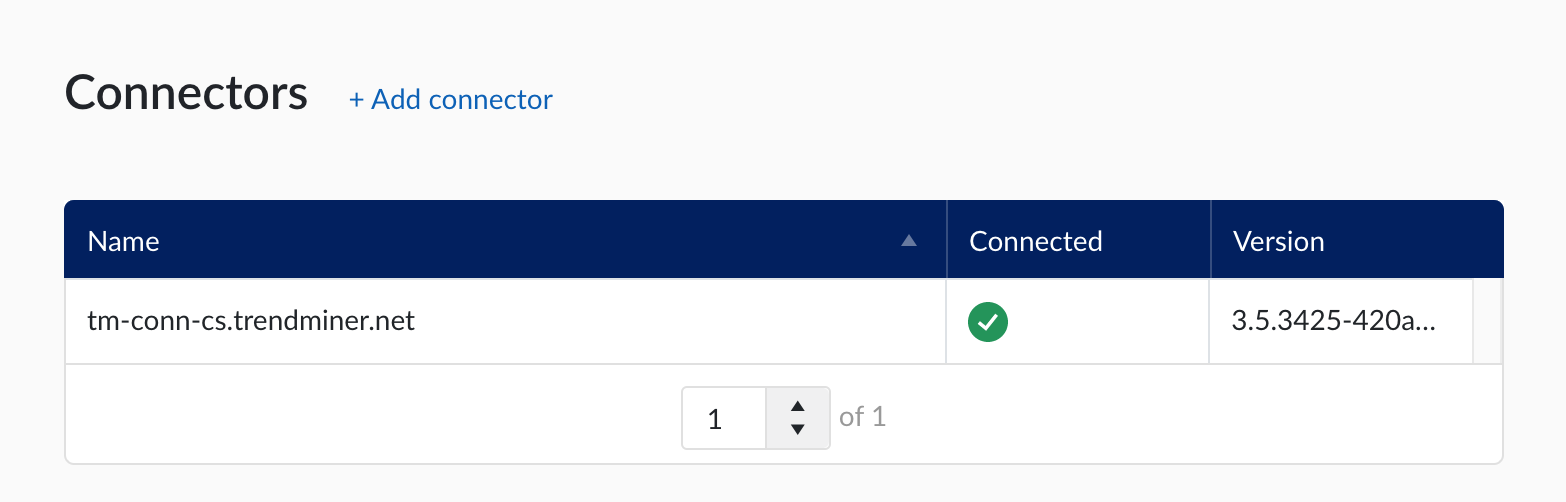
If your connector is added successfully, the version will be shown in ConfigHub and you are ready for the next step.
List your provider
When this step is implemented you will see your provider listed in ConfigHub in the dropdown of available providers. An implementation of this endpoint provides meta data for a specific provider.
It describes what capabilities it has:
TIMESERIES for time series data ingestion into TrendMiner
ASSET for asset data ingestion into TrendMiner
CONTEXT for contextual data ingestion into TrendMiner
The endpoint to implement is:
GET /api/provider
Example output:
[
  {
    "name": "myProvider",
    "label": "My Provider",
    "experimental": false,
    "capabilities": [
      "TIME_SERIES"
    ],
    "properties": [
      {
        "name": "PREFIX",
        "type": "SINGLE_LINE",
        "label": "Prefix",
        "placeholder": "",
        "capabilities": [
          "TIME_SERIES"
        ],
        "required": false,
        "encrypted": false
      },
      {
        "name": "TAGFILTER",
        "type": "SINGLE_LINE",
        "label": "Tag filter",
        "placeholder": ".*BA.*",
        "capabilities": [
          "TIME_SERIES"
        ],
        "required": false,
        "encrypted": false
      },
      {
        "name": "HOST",
        "type": "SINGLE_LINE",
        "label": "Host",
        "placeholder": "Host",
        "capabilities": [],
        "required": true,
        "encrypted": false
      },
      {
        "name": "USERNAME",
        "type": "SINGLE_LINE",
        "label": "Username",
        "placeholder": "",
        "capabilities": [],
        "required": false,
        "encrypted": false
      },
      {
        "name": "PASSWORD",
        "type": "SINGLE_LINE",
        "label": "Password",
        "placeholder": "",
        "capabilities": [],
        "required": false,
        "encrypted": true
      }
    ]
]
ProviderCapabilities
An object that represents a provider capabilities:
Field Name | Type | Description | Format |
|---|---|---|---|
name | String | The name of the provider | |
label | String | The label of the provider name that will be visible in ConfigHub | |
experimental | Boolean | Only non experimental providers will be visible in TrendMiner | |
capabilities | List of [string] | A collection of 1 or more capabilities the provider has | TIMESERIES ASSET CONTEXT |
properties | List of ProviderCapabilitiesProperty | Optional configuration options for this provider. In case left empty, TrendMiner will fall-back to default ones. |
ProviderCapabilitiesProperty
An object that represents a provider capabilities property:
Field Name | Type | Description | Format |
|---|---|---|---|
name | String | A name for the configuration property | |
type | String | There are 4 types available to visualise this configuration option in TrendMiner either as a textfield, a drop down, a checkbox or a multiline text area | SINGLE_LINE MULTI_LINE BOOL DROPDOWN |
label | String | An optional label to be shown in TrendMiner | |
placeholder | String | An optional placeholder text to be shown in TrendMiner | |
capabilities | List of [string] | A property can be assigned to a specific capability or can be shared between multiple capabilities | TIMESERIES ASSET CONTEXT |
required | Boolean | Indicates whether this property is mandatory to fill in | |
encrypted | Boolean | Indicates whether this property is encrypted |
Important
1 provider must consistently return the same capabilities and properties. Connecting a TrendMiner appliance to different connectors which support the same provider but with different capabilities or properties can lead to issues.
When accidentally returning inconsistent provider capabilities or properties for different connectors potential issues can be fixed by making sure all connectors return the same capabilities and properties for a single provider and then disconnecting and reconnecting the connectors.
List your data sources
When this step is implemented you will see your data source listed in ConfigHub.
One instance of a connector can connect to multiple data sources. The connector should provide an endpoint which returns a list of data sources it connects to. Administrators can then grant users permissions to one or more data sources.
The endpoint to implement is:
GET /api/database
Example output:
{
    "DbId": 1,
    "Name": "myHistorian",
    "Prefix": "",
    "TagFilter": "",
    "Provider": "myProvider",
    "DataSource": "",
    "UserId": "",
    "Password": "",
    "Version": "",
    "OnlySupportsRawValues": true
    "Properties": []
}
Notes:
All fields are required to be present, but most can be left blank
Fields follow the PascalCase naming convention, as is common in .NET
Output requirements:
DbId: the DbId field is mandatory and should return a numerical unique identifier. This ID is used in PUT and DELETE calls and in the /test endpoint (discussed in the next section). If no unique ID is returned the /test endpoint cannot be called successfully in ConfigHub and your data source will not show a green connection status.
Name: the 'Name' free-text field is mandatory and each data source name needs to be unique per TrendMiner installation. The name is provided when querying the tag list or tag data.
Note
Note that multiple connectors can be connected to TrendMiner. As the data source name needs to be unique per installation this implies it needs to be unique for the combined output of all connectors. If a duplicate data source name is encountered the tags of one of the duplicate data sources will not be synced to TrendMiner and this will be shown as an error in the sync status in ConfigHub.
Prefix: can be left empty for a first POC implementation.
Note
TrendMiner does not support duplicate tags. If 2 tags with exactly the same name are synced to TrendMiner, analytics, calculations and indexing on/for these tags might fail. Data source prefixes can be used to prefix all the tag names such that duplicate tags can not occur between different data sources.
TagFilter: can be left empty for a first POC implementation.
Provider: the 'Provider' free-text field is mandatory and allows you to distinguish between different connection implementations in 1 custom connector. The provider will also be shown in ConfigHub in the data source details.
DataSource: can be left empty for a first POC implementation.
UserId + Password: can be left empty for a first POC implementation.
Version: can be left empty for a first POC implementation.
OnlySupportsRawValues: the OnlySupportsRawValues boolean field indicates whether the analytics optimisation is supported. If all raw data points are returned for index calls and no optimisation is applied "true" should be returned. For a first POC implementation we recommend only supporting raw values (and thus returning "true").
If this endpoint is implemented successfully you can verify if your data source is visible in ConfigHub. Navigate to "Data sources" in the left menu and check if your data source shows up.
Important
The connection status of your data source will show a red dot, indicating the data source is not successfully connected. This is because the /test endpoint is not implemented yet, which is used to verify a successful connection. The next paragraph explains how to implement this endpoint.
Testing the connection (optional)
The /test endpoint is called by the appliance to indicate if a successful call could be made to the data source. Your implementation can choose how a successful connection is defined. A successful connection can for example be defined as:
Doing a successful connect to a local database
Doing a successful connect to a remote data lake
Getting a success message from calling a specific test endpoint of the historian you are connecting to
...
The API endpoint to implement:
GET /api/database/<id>/test
<id> is the identifier returned by the GET /api/database call.
A successful connection response should be a 200 response of the following structure:
{
  "healthy": true
}
A failed connection response can be any 4xx or 5xx response.
[Optional] Create a new datasource
If you want to be able to add new datasources from ConfigHub, this endpoint should be implemented as well.
POST /api/database
The request body that will be sent will be of the following structure and needs to be processed by the connector so that the datasource is added.
{
    "Name": "myHistorian",
    "Prefix": "",
    "TagFilter": "",
    "Provider": "myProvider",
    "DataSource": "",
    "UserId": "",
    "Password": "",
    "Version": "",
    "OnlySupportsRawValues": true
    "Properties": [
        "key": "value",
         ...
    ]
}
If there are no additional properties to pass on, then the "Properties" attribute itself should not be passed on. Upon successful creation, the endpoint should return a 200 response returned the id of the newly created datasource.
Make tags available in TrendMiner
When this step is implemented your tags will be accessible in TrendHub.
A 'tag' refers to one time series. TrendMiner requires the metadata of all tags to be known before they can be used. All tags in one data source need to be returned in a flat list. The tags query should accept one query parameter which will be passed on to the next endpoint which needs to be implemented for your custom connector:
Parameter:
historianName: name of the data source that should be queried.
Example query:
GET /api/v2/tags?historianName=<historianName>
where <historianName> is value of the "Name" field returned by the GET /api/database call.
Example output:
[
  {
    "Name": "React5_temp001",
    "Description": "Reactor 5 - Cooling water temperature",
    "Units": "C",
    "Type": "ANALOG"
  },
  {
    "Name": "React5_press",
    "Description": "Reactor 5 - Top pressure",
    "Units": "",
    "Type": "ANALOG"
  },
  {
    "Name": "React5_phas",
    "Description": "Reactor 5 - Production Phases",
    "Units": "",
    "Type": "STRING"
  }
]
Output requirements:
All fields are required. Description and Units can be left blank.
Name: free text indicating the tag name, this name will be used to identify the tag in TrendMiner. Tag names need to be unique!
Type: "ANALOG", "DISCRETE", "DIGITAL" or "STRING", depending on the sensor data. This article explains the details on the different tag types TrendMiner supports.
Notes:
All numerical values in ANALOG and DISCRETE tags are floats. DISCRETE does not mean only integer values are allowed.
booleans can be sent as DISCRETE values (0/1) or STRING (true/false). Prefer the DISCRETE type for efficiency reasons.
string values have a maximum of 255 characters.
DIGITAL tags can often be represented as DISCRETE or STRING tags. This avoids the need to implement the /api/v2/tags/digitalstates endpoint. Note that DIGITAL tags are left out of scope for this quick start guide.
When this endpoint is implemented, you'll need to make sure your user has access to this data source before you can find the tags from the data source in TrendMiner. This article describes how you can assign the right permissions.
Also make sure to sync the data source to TrendMiner to make sure the tag list is updated.
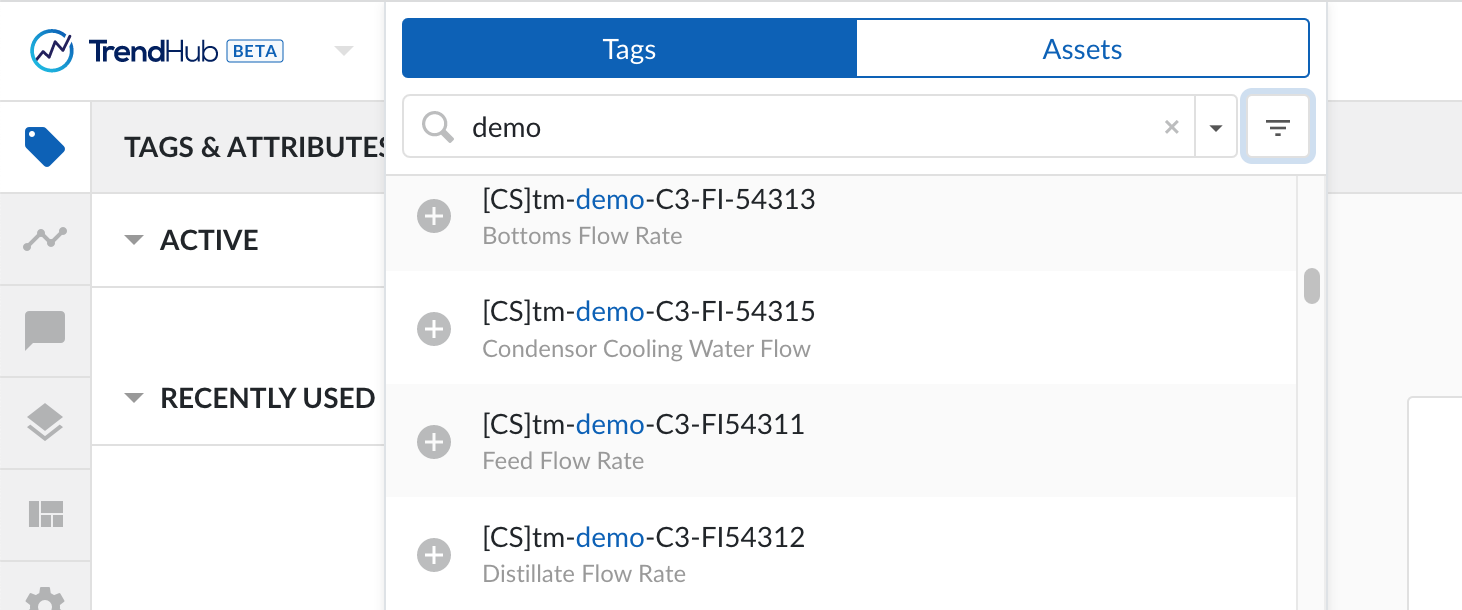
Once the right permissions are assigned, log in to TrendHub and you should be able to search your tag names and descriptions in the tag browser. If this looks ok, you're ready for the next step.
Provide tag data
When this step is implemented you will be able to visualise your tags in TrendMiner and run analytics on them.
TrendMiner requests values for a given tag in a specific time period while indexing data. Implementations of the Connector API can choose to either return raw values, or implement an analytics optimization. Implementing the analytics optimization is only recommended when the data source natively supports generating plots.
Important
Returning RAW data points and ignoring the configured index resolution in TrendMiner could in extreme cases result in memory issues in the appliance. For optimal performance we advise to not return more than 48 data points per minute for servers which meet only the minimal system requirements.
Four query parameters are important:
historianName: the name of the time series data source that should be queried.
tagName: the name of the tag.
startDate: the RFC3339 start date of the time period. TrendMiner will always query using UTC timestamps.
endDate: the RFC3339 end date of the time period. TrendMiner will always query using UTC timestamps.
The other query parameters are relevant for the plot optimized representation only and can be ignored in a first POC implementation.
Example query:
GET /api/v2/tags/indexvalues?historianName=myHistorian&tagName=React5_temp001&tagType=ANALOG&interpolationType=DEFAULT&startDate=2021-01-01T00:00:00Z&endDate=2021-02-01T00:00:00Z&numberOfIntervals=44640'
Example output:
[
{
	"Ts": "2021-01-01T00:00:00.0000000Z",
	"Value": "73.1889496"
},
{
	"Ts": "2021-01-01T00:31:24.0000000Z",
	"Value": "85.7846146"
},
{
	"Ts": "2021-01-01T01:31:24.0000000Z",
	"Value": "98.4507751"
},
{
	"Ts": "2021-01-01T02:31:24.0000000Z",
	"Value": "98.1346054"
},

...

{
	"Ts": "2021-01-31T20:44:54.0000000Z",
	"Value": "3.7891531"
},
{
	"Ts": "2021-01-31T21:57:54.0000000Z",
	"Value": "24.2102547"
},
{
	"Ts": "2021-02-01T00:00:00.0000000Z",
	"Value": "73.1889496"
}
]
Each data point in the response contains two fields:
Ts: the RFC3339 timestamp of the point.
Value: a string, containing either a numerical value using the . as decimal separator for tags with type ANALOG or DISCRETE, or a string value for tags with type STRING. Tags of type DIGITAL need some more information and are left out of scope for this quick start guide.
The Index values response needs to adhere to some specific rules:
Timestamps should be in chronological order, oldest first
All timestamps returned should be inside of the requested time interval
The complete response should be returned within a reasonable timeframe of 5-30 seconds. A well performing data source returns 1 month of data in around 1 second. The response time can be influenced by tweaking the index granularity setting in ConfigHub. Check the user documentation for more info.
Acceptable amount of datapoints within the given timeframe. The number of data points returned can be influenced by tweaking the index granularity setting in ConfigHub. Check the user documentation for more info.
When this endpoint is implemented, the tags can be indexed in TrendMiner. Tag indexing will start as soon as the tag is added to the active tag list. If the tag was already added before the tag indexing status might be on 'failed' and you might need to manually trigger re-indexing.
Once the tag is indexed it can be visualized on the chart and it can be used in analyses.