How to visualize a PowerBI report in a DashHub external content tile?
There are two options:
Option 1: PowerBI reporting server is running as a cloud service
Add your PowerBI server to the allowed domains in ConfigHub:
Navigate to ConfigHub and scroll all the way down in the left menu.
Click on ‘External Content’ just below DashHub.
Click on add and fill in ‘https://<yourPowerBIServer>.net/***’ in the URL field and choose a name.
Generate an embedded link in PowerBI for the report you want to visualize in a DashHub tile.
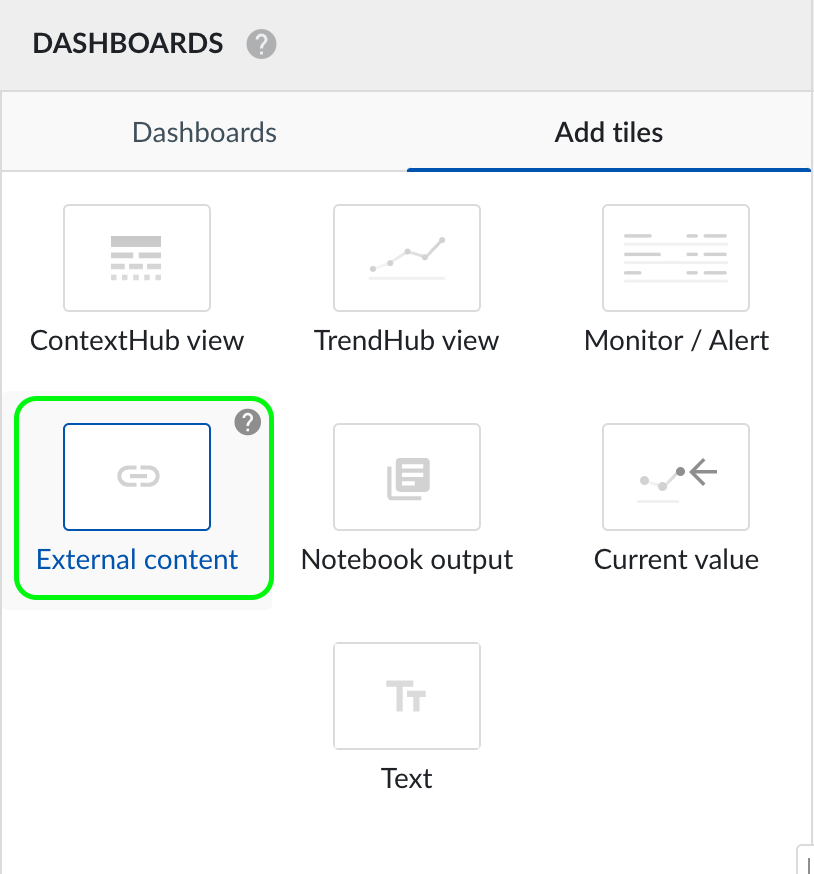
Open DashHub and choose to create a new tile.
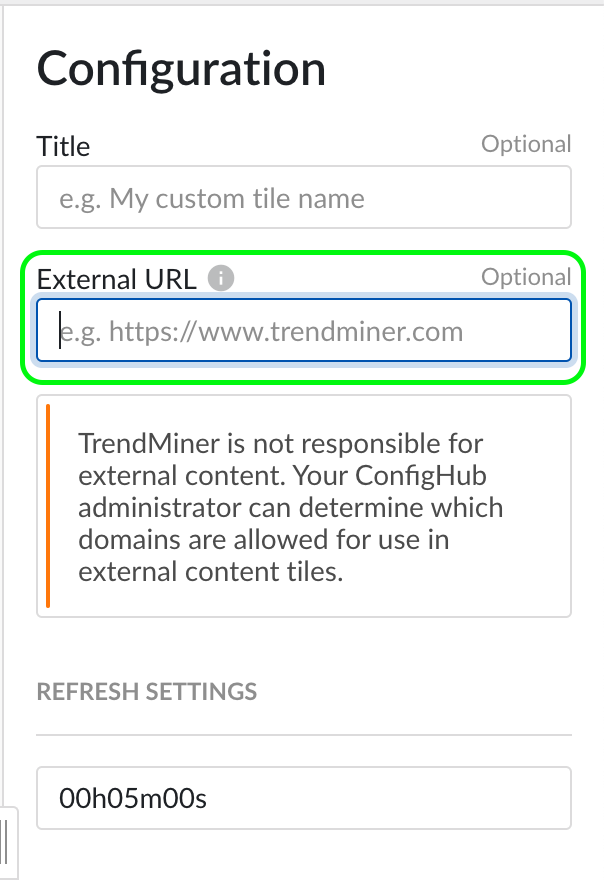
In the selection window choose ‘external content’ (a) and in the ‘external URL’ field, fill in the previously generated embedded link (b):
Now you will see a tile appear with the Power BI report embedded in it.
Option 2: PowerBI reporting server hosted on-premises
Add your PowerBI server to the allowed domains in ConfigHub:
Navigate to ConfigHub and scroll all the way down in the left menu.
Click on ‘External Content’ just below DashHub.
Click on add and fill in ‘https://<yourPowerBIServer>.net/***’ in the URL field and choose a name.
Open the PowerBI report within your browser and copy the complete URL that you can find in the top search bar.
Example: https://<yourPowerBIServer.net>/Myreport
Add
?rs:embed=trueat the end of this URL:Example embedded link: https://<yourPowerBIServer.net/Myreport?rs:embed-true
Open DashHub and choose to create a new tile.
In the selection window choose ‘external content’ (a) and in the ‘external URL’ field, fill in the previously generated embedded link (b):
Now you will see a tile appear with the Power BI report embedded in it.